注意
跳到最後以下載完整的範例程式碼。
用於多欄/列子圖佈局的 GridSpec#
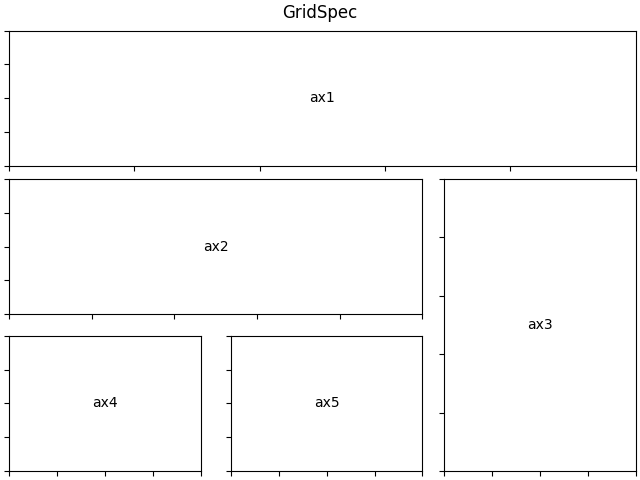
GridSpec 是一種彈性的方式來佈局子圖網格。以下是一個 3x3 網格的範例,其中軸橫跨所有三欄、兩欄和兩列。
import matplotlib.pyplot as plt

from matplotlib.gridspec import GridSpec


def format_axes(fig):
    for i, ax in enumerate(fig.axes):
        ax.text(0.5, 0.5, "ax%d" % (i+1), va="center", ha="center")
        ax.tick_params(labelbottom=False, labelleft=False)

fig = plt.figure(layout="constrained")

gs = GridSpec(3, 3, figure=fig)
ax1 = fig.add_subplot(gs[0, :])
# identical to ax1 = plt.subplot(gs.new_subplotspec((0, 0), colspan=3))
ax2 = fig.add_subplot(gs[1, :-1])
ax3 = fig.add_subplot(gs[1:, -1])
ax4 = fig.add_subplot(gs[-1, 0])
ax5 = fig.add_subplot(gs[-1, -2])

fig.suptitle("GridSpec")
format_axes(fig)

plt.show()
腳本總執行時間:(0 分鐘 1.308 秒)