注意
前往結尾下載完整範例程式碼。
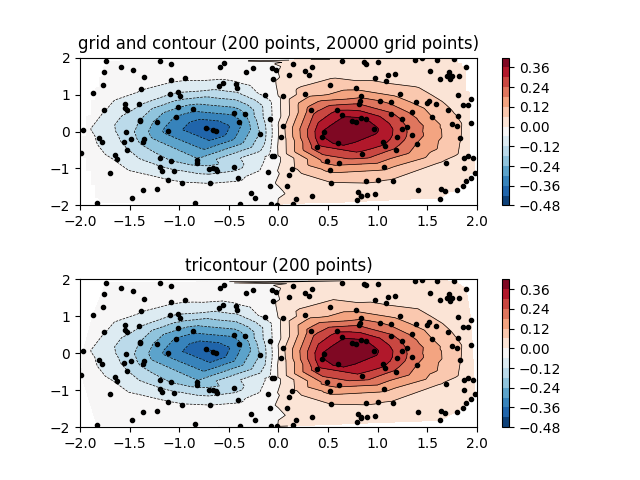
不規則間距資料的等高線圖#
比較在規則網格上內插的不規則間距資料的等高線圖與非結構化三角形網格的 tricontour 圖。
由於contour和contourf預期資料存在於規則網格上,繪製不規則間距資料的等高線圖需要不同的方法。兩種選項是
首先將資料內插到規則網格。這可以使用內建方法完成,例如透過
LinearTriInterpolator,或使用外部功能,例如透過scipy.interpolate.griddata。然後使用常用的contour繪製內插資料。直接使用
tricontour或tricontourf,它們將在內部執行三角剖分。
此範例顯示這兩種方法的作用。
import matplotlib.pyplot as plt
import numpy as np

import matplotlib.tri as tri

np.random.seed(19680801)
npts = 200
ngridx = 100
ngridy = 200
x = np.random.uniform(-2, 2, npts)
y = np.random.uniform(-2, 2, npts)
z = x * np.exp(-x**2 - y**2)

fig, (ax1, ax2) = plt.subplots(nrows=2)

# -----------------------
# Interpolation on a grid
# -----------------------
# A contour plot of irregularly spaced data coordinates
# via interpolation on a grid.

# Create grid values first.
xi = np.linspace(-2.1, 2.1, ngridx)
yi = np.linspace(-2.1, 2.1, ngridy)

# Linearly interpolate the data (x, y) on a grid defined by (xi, yi).
triang = tri.Triangulation(x, y)
interpolator = tri.LinearTriInterpolator(triang, z)
Xi, Yi = np.meshgrid(xi, yi)
zi = interpolator(Xi, Yi)

# Note that scipy.interpolate provides means to interpolate data on a grid
# as well. The following would be an alternative to the four lines above:
# from scipy.interpolate import griddata
# zi = griddata((x, y), z, (xi[None, :], yi[:, None]), method='linear')

ax1.contour(xi, yi, zi, levels=14, linewidths=0.5, colors='k')
cntr1 = ax1.contourf(xi, yi, zi, levels=14, cmap="RdBu_r")

fig.colorbar(cntr1, ax=ax1)
ax1.plot(x, y, 'ko', ms=3)
ax1.set(xlim=(-2, 2), ylim=(-2, 2))
ax1.set_title('grid and contour (%d points, %d grid points)' %
              (npts, ngridx * ngridy))

# ----------
# Tricontour
# ----------
# Directly supply the unordered, irregularly spaced coordinates
# to tricontour.

ax2.tricontour(x, y, z, levels=14, linewidths=0.5, colors='k')
cntr2 = ax2.tricontourf(x, y, z, levels=14, cmap="RdBu_r")

fig.colorbar(cntr2, ax=ax2)
ax2.plot(x, y, 'ko', ms=3)
ax2.set(xlim=(-2, 2), ylim=(-2, 2))
ax2.set_title('tricontour (%d points)' % npts)

plt.subplots_adjust(hspace=0.5)
plt.show()
參考文獻
此範例中顯示了以下函式、方法、類別和模組的使用
腳本的總執行時間:(0 分鐘 1.522 秒)