注意
跳至結尾下載完整範例程式碼。
分開計算和繪製盒鬚圖#
針對給定數據集繪製 盒鬚圖,包含兩個主要操作,也可以分開使用
計算盒鬚圖統計資訊:
matplotlib.cbook.boxplot_stats繪製盒鬚圖:
matplotlib.axes.Axes.bxp
因此,ax.boxplot(data) 等效於
所有樣式關鍵字引數在 boxplot 和 bxp 之間都是相同的,並且它們從 boxplot 傳遞到 bxp。然而,boxplot 的 tick_labels 參數會轉換成 boxplot_stats 中的通用 labels 參數,因為標籤與資料相關並且附加到每個資料集的傳回字典。
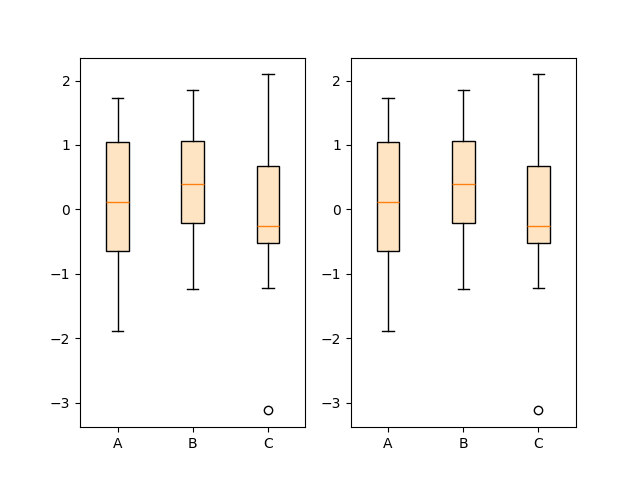
下列程式碼示範了兩種方法之間的等效性。
import matplotlib.pyplot as plt
import numpy as np

from matplotlib import cbook

np.random.seed(19680801)
data = np.random.randn(20, 3)

fig, (ax1, ax2) = plt.subplots(1, 2)

# single boxplot call
ax1.boxplot(data, tick_labels=['A', 'B', 'C'],
            patch_artist=True, boxprops={'facecolor': 'bisque'})

# separate calculation of statistics and plotting
stats = cbook.boxplot_stats(data, labels=['A', 'B', 'C'])
ax2.bxp(stats, patch_artist=True, boxprops={'facecolor': 'bisque'})
如果您需要明確地將統計資訊用於其他目的,或者要將統計資訊重複用於多個繪圖,則使用個別函式可以預先計算統計資訊。
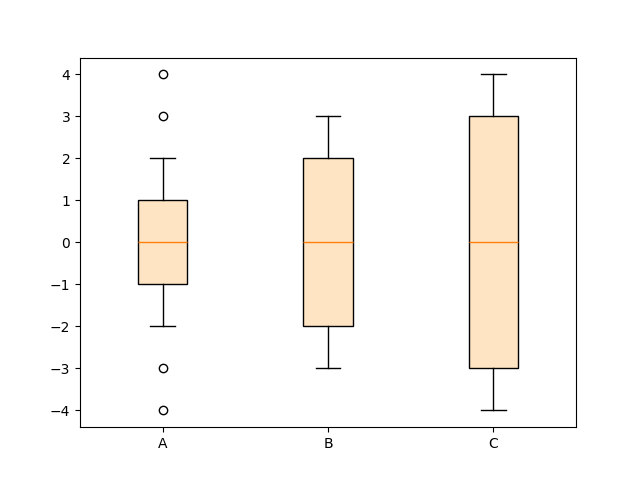
反之,如果您已經有統計參數,也可以直接使用 bxp 函式
fig, ax = plt.subplots()

stats = [
    dict(med=0, q1=-1, q3=1, whislo=-2, whishi=2, fliers=[-4, -3, 3, 4], label='A'),
    dict(med=0, q1=-2, q3=2, whislo=-3, whishi=3, fliers=[], label='B'),
    dict(med=0, q1=-3, q3=3, whislo=-4, whishi=4, fliers=[], label='C'),
]

ax.bxp(stats, patch_artist=True, boxprops={'facecolor': 'bisque'})

plt.show()
參考
此範例中顯示了下列函式、方法、類別和模組的使用