注意
前往末尾下載完整的範例程式碼。
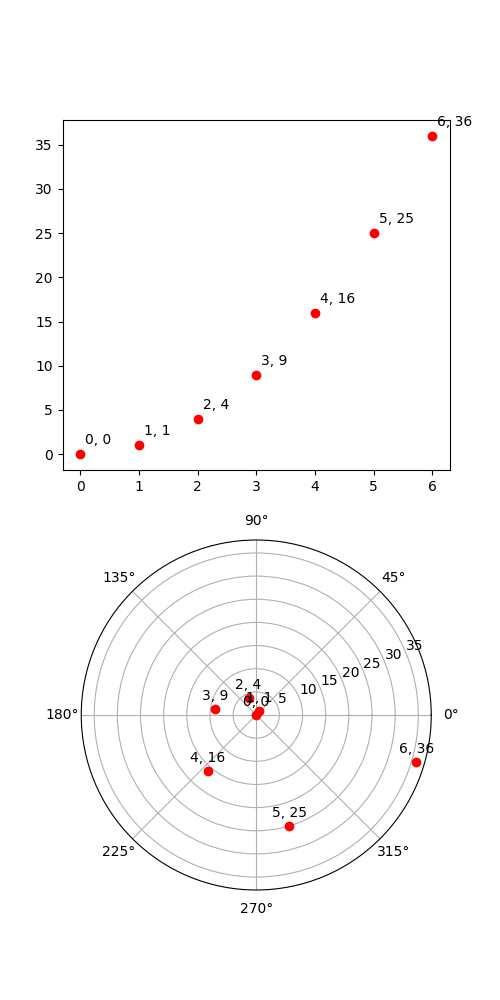
transforms.offset_copy#
此範例說明如何使用 transforms.offset_copy 建立一個轉換,該轉換將繪圖元素(例如文字字串)放置在相對於任何座標中給定位置的螢幕座標(點或英寸)中指定的偏移量處。
每個 Artist(文字、Line2D 等)都有一個轉換,可以在建立 Artist 時設定,例如透過對應的 pyplot 函數。預設情況下,這通常是 Axes.transData 轉換,從資料單位到螢幕像素。我們可以使用 offset_copy 函數建立此轉換的修改副本,其中修改包含偏移量。
import matplotlib.pyplot as plt
import numpy as np

import matplotlib.transforms as mtransforms

xs = np.arange(7)
ys = xs**2

fig = plt.figure(figsize=(5, 10))
ax = plt.subplot(2, 1, 1)

# If we want the same offset for each text instance,
# we only need to make one transform.  To get the
# transform argument to offset_copy, we need to make the Axes
# first; the subplot function above is one way to do this.
trans_offset = mtransforms.offset_copy(ax.transData, fig=fig,
                                       x=0.05, y=0.10, units='inches')

for x, y in zip(xs, ys):
    plt.plot(x, y, 'ro')
    plt.text(x, y, '%d, %d' % (int(x), int(y)), transform=trans_offset)


# offset_copy works for polar plots also.
ax = plt.subplot(2, 1, 2, projection='polar')

trans_offset = mtransforms.offset_copy(ax.transData, fig=fig,
                                       y=6, units='dots')

for x, y in zip(xs, ys):
    plt.polar(x, y, 'ro')
    plt.text(x, y, '%d, %d' % (int(x), int(y)),
             transform=trans_offset,
             horizontalalignment='center',
             verticalalignment='bottom')

plt.show()