注意
前往結尾以下載完整範例程式碼。
游標#
import matplotlib.pyplot as plt
import numpy as np
from matplotlib.widgets import Cursor
# Fixing random state for reproducibility
np.random.seed(19680801)
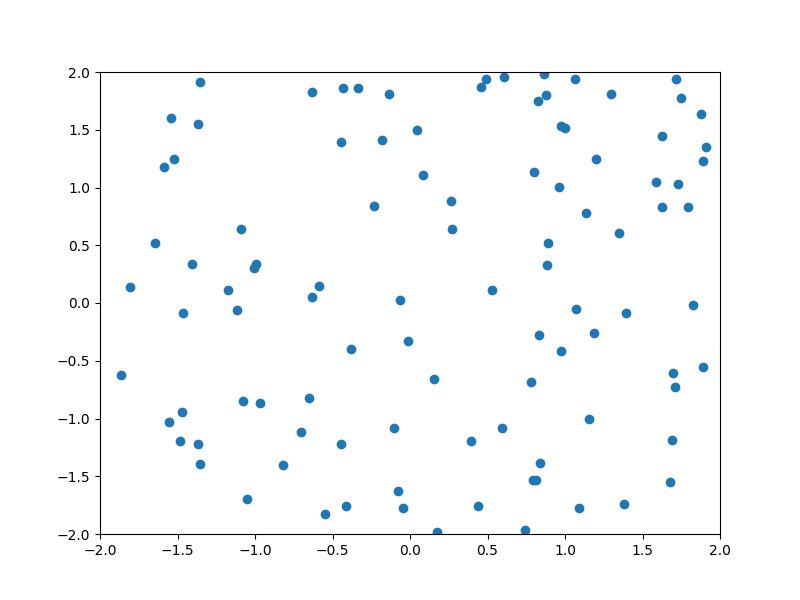
fig, ax = plt.subplots(figsize=(8, 6))
x, y = 4*(np.random.rand(2, 100) - .5)
ax.plot(x, y, 'o')
ax.set_xlim(-2, 2)
ax.set_ylim(-2, 2)
# Set useblit=True on most backends for enhanced performance.
cursor = Cursor(ax, useblit=True, color='red', linewidth=2)
plt.show()