注意
跳到結尾以下載完整的範例程式碼。
雙直方圖#
如何使用 Matplotlib 繪製雙直方圖。
import matplotlib.pyplot as plt
import numpy as np

# Create a random number generator with a fixed seed for reproducibility
rng = np.random.default_rng(19680801)
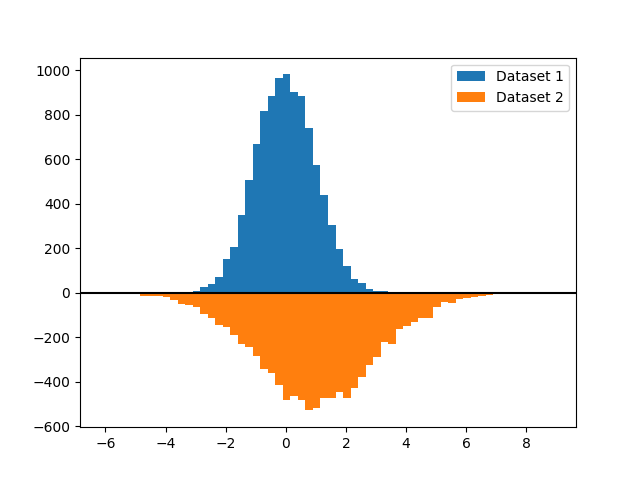
產生數據並繪製雙直方圖#
要產生雙直方圖,我們需要兩個數據集(每個數據集都是數字向量)。我們將使用 plt.hist() 繪製兩個直方圖,並將第二個直方圖的權重設定為負數。我們將在下面產生數據並繪製雙直方圖。
N_points = 10_000

# Generate two normal distributions
dataset1 = np.random.normal(0, 1, size=N_points)
dataset2 = np.random.normal(1, 2, size=N_points)

# Use a constant bin width to make the two histograms easier to compare visually
bin_width = 0.25
bins = np.arange(np.min([dataset1, dataset2]),
                    np.max([dataset1, dataset2]) + bin_width, bin_width)

fig, ax = plt.subplots()

# Plot the first histogram
ax.hist(dataset1, bins=bins, label="Dataset 1")

# Plot the second histogram
# (notice the negative weights, which flip the histogram upside down)
ax.hist(dataset2, weights=-np.ones_like(dataset2), bins=bins, label="Dataset 2")
ax.axhline(0, color="k")
ax.legend()

plt.show()
腳本總執行時間:(0 分 1.118 秒)