注意
前往結尾下載完整的範例程式碼。
使用 ConciseDateFormatter 設定日期刻度格式#
為具有日期資料的軸尋找良好的刻度值並格式化刻度通常是一項挑戰。ConciseDateFormatter旨在改善為刻度標籤選擇的字串,並盡可能減少這些刻度標籤中使用的字串。
注意
此格式器是 Matplotlib 未來版本中成為預設日期刻度格式器的候選者。請向 GitHub 儲存庫或郵件列表報告任何問題或改進建議。
import datetime

import matplotlib.pyplot as plt
import numpy as np

import matplotlib.dates as mdates
首先,預設格式器。
base = datetime.datetime(2005, 2, 1)
dates = [base + datetime.timedelta(hours=(2 * i)) for i in range(732)]
N = len(dates)
np.random.seed(19680801)
y = np.cumsum(np.random.randn(N))

fig, axs = plt.subplots(3, 1, layout='constrained', figsize=(6, 6))
lims = [(np.datetime64('2005-02'), np.datetime64('2005-04')),
        (np.datetime64('2005-02-03'), np.datetime64('2005-02-15')),
        (np.datetime64('2005-02-03 11:00'), np.datetime64('2005-02-04 13:20'))]
for nn, ax in enumerate(axs):
    ax.plot(dates, y)
    ax.set_xlim(lims[nn])
    # rotate_labels...
    for label in ax.get_xticklabels():
        label.set_rotation(40)
        label.set_horizontalalignment('right')
axs[0].set_title('Default Date Formatter')
plt.show()
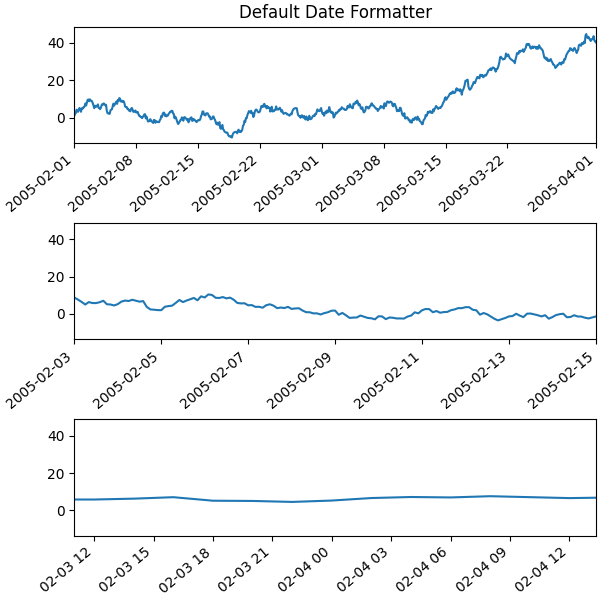
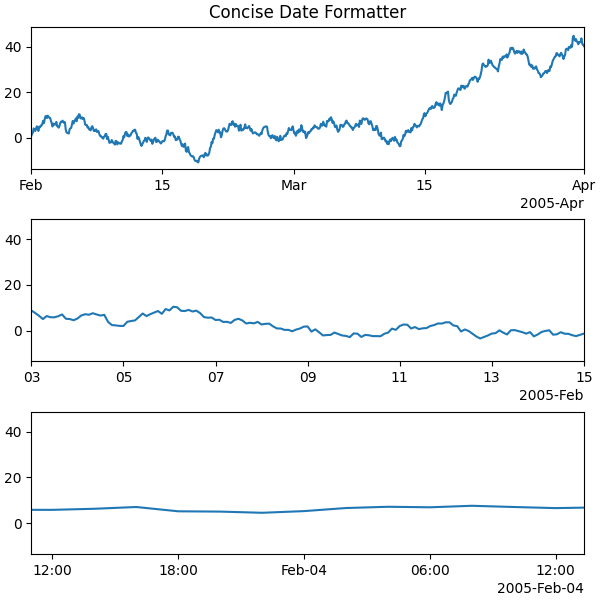
預設日期格式器相當冗長,因此我們可以選擇使用 ConciseDateFormatter,如下所示。請注意,在此範例中,標籤不需要像預設格式器那樣旋轉,因為標籤已盡可能縮小。
fig, axs = plt.subplots(3, 1, layout='constrained', figsize=(6, 6))
for nn, ax in enumerate(axs):
    locator = mdates.AutoDateLocator(minticks=3, maxticks=7)
    formatter = mdates.ConciseDateFormatter(locator)
    ax.xaxis.set_major_locator(locator)
    ax.xaxis.set_major_formatter(formatter)

    ax.plot(dates, y)
    ax.set_xlim(lims[nn])
axs[0].set_title('Concise Date Formatter')

plt.show()
如果所有對具有日期的軸的呼叫都要使用此轉換器進行,則最方便的方法可能是在您匯入的地方使用單位登錄
import matplotlib.units as munits

converter = mdates.ConciseDateConverter()
munits.registry[np.datetime64] = converter
munits.registry[datetime.date] = converter
munits.registry[datetime.datetime] = converter

fig, axs = plt.subplots(3, 1, figsize=(6, 6), layout='constrained')
for nn, ax in enumerate(axs):
    ax.plot(dates, y)
    ax.set_xlim(lims[nn])
axs[0].set_title('Concise Date Formatter')

plt.show()

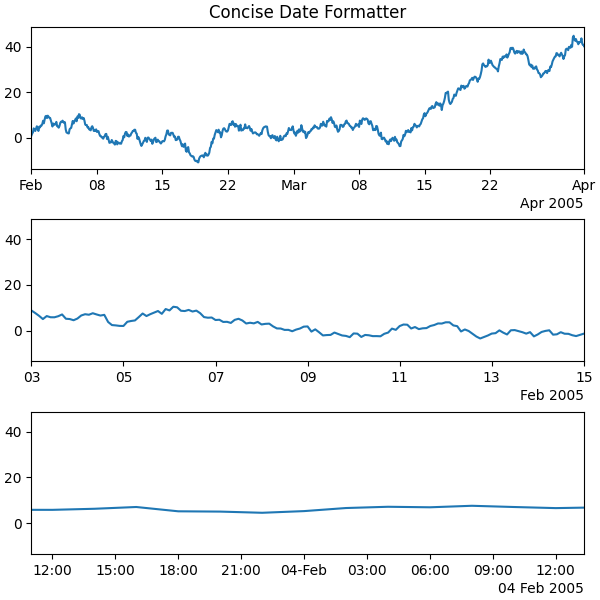
日期格式的本地化#
如果預設格式不理想,可以透過操作三個字串列表之一來本地化日期格式。
formatter.formats 格式列表用於正常的刻度標籤。共有六個層級:年、月、日、小時、分鐘、秒。formatter.offset_formats 是軸右側「偏移」字串的格式。這通常比刻度標籤更詳細。最後,formatter.zero_formats 是「零」刻度的格式。這些是屬於年、月或月中第一天,或第零小時、分鐘或秒的刻度值。這些通常與上一層級的刻度格式相同。例如,如果軸限制表示刻度主要為天,則我們僅使用「Mar」標示 2005 年 3 月 1 日。如果軸限制主要為小時,則我們僅使用「Feb-4」標示 2 月 4 日 00:00。
請注意,這些格式列表也可以作為選用關鍵字引數傳遞給 ConciseDateFormatter。
在這裡,我們將標籤修改為「日 月 年」,而不是 ISO「年 月 日」
fig, axs = plt.subplots(3, 1, layout='constrained', figsize=(6, 6))

for nn, ax in enumerate(axs):
    locator = mdates.AutoDateLocator()
    formatter = mdates.ConciseDateFormatter(locator)
    formatter.formats = ['%y',  # ticks are mostly years
                         '%b',       # ticks are mostly months
                         '%d',       # ticks are mostly days
                         '%H:%M',    # hrs
                         '%H:%M',    # min
                         '%S.%f', ]  # secs
    # these are mostly just the level above...
    formatter.zero_formats = [''] + formatter.formats[:-1]
    # ...except for ticks that are mostly hours, then it is nice to have
    # month-day:
    formatter.zero_formats[3] = '%d-%b'

    formatter.offset_formats = ['',
                                '%Y',
                                '%b %Y',
                                '%d %b %Y',
                                '%d %b %Y',
                                '%d %b %Y %H:%M', ]
    ax.xaxis.set_major_locator(locator)
    ax.xaxis.set_major_formatter(formatter)

    ax.plot(dates, y)
    ax.set_xlim(lims[nn])
axs[0].set_title('Concise Date Formatter')

plt.show()
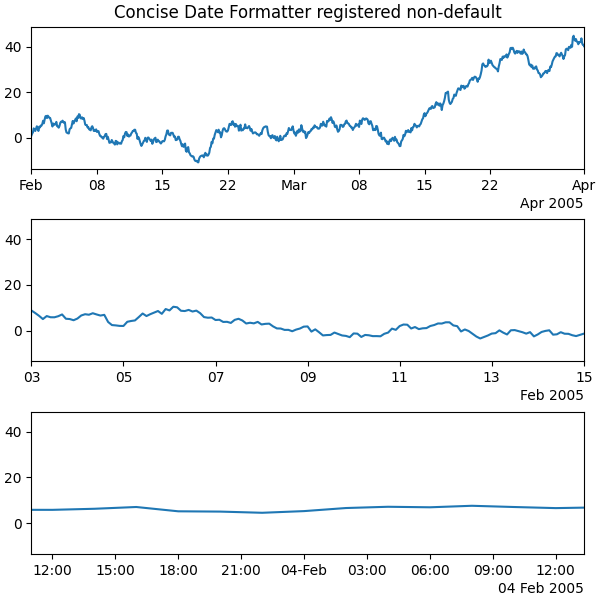
註冊具有本地化的轉換器#
ConciseDateFormatter 沒有 rcParams 項目,但可以透過將關鍵字引數傳遞給 ConciseDateConverter 並使用單位登錄註冊您將使用的資料類型來實現本地化
import datetime

formats = ['%y',          # ticks are mostly years
           '%b',     # ticks are mostly months
           '%d',     # ticks are mostly days
           '%H:%M',  # hrs
           '%H:%M',  # min
           '%S.%f', ]  # secs
# these can be the same, except offset by one level....
zero_formats = [''] + formats[:-1]
# ...except for ticks that are mostly hours, then it's nice to have month-day
zero_formats[3] = '%d-%b'
offset_formats = ['',
                  '%Y',
                  '%b %Y',
                  '%d %b %Y',
                  '%d %b %Y',
                  '%d %b %Y %H:%M', ]

converter = mdates.ConciseDateConverter(
    formats=formats, zero_formats=zero_formats, offset_formats=offset_formats)

munits.registry[np.datetime64] = converter
munits.registry[datetime.date] = converter
munits.registry[datetime.datetime] = converter

fig, axs = plt.subplots(3, 1, layout='constrained', figsize=(6, 6))
for nn, ax in enumerate(axs):
    ax.plot(dates, y)
    ax.set_xlim(lims[nn])
axs[0].set_title('Concise Date Formatter registered non-default')

plt.show()
指令碼的總執行時間: (0 分鐘 6.129 秒)