注意
前往結尾下載完整範例程式碼。
使用關鍵字繪圖#
某些資料結構,例如 dict、結構化的 numpy 陣列或pandas.DataFrame透過字串索引存取 data[key] 來提供對已標記資料的存取。
對於這些資料類型,Matplotlib 支援透過 data 關鍵字引數傳遞整個資料結構,並使用字串名稱作為繪圖函式參數,您通常會在其中傳遞您的資料。
import matplotlib.pyplot as plt
import numpy as np
np.random.seed(19680801)
data = {'a': np.arange(50),
'c': np.random.randint(0, 50, 50),
'd': np.random.randn(50)}
data['b'] = data['a'] + 10 * np.random.randn(50)
data['d'] = np.abs(data['d']) * 100
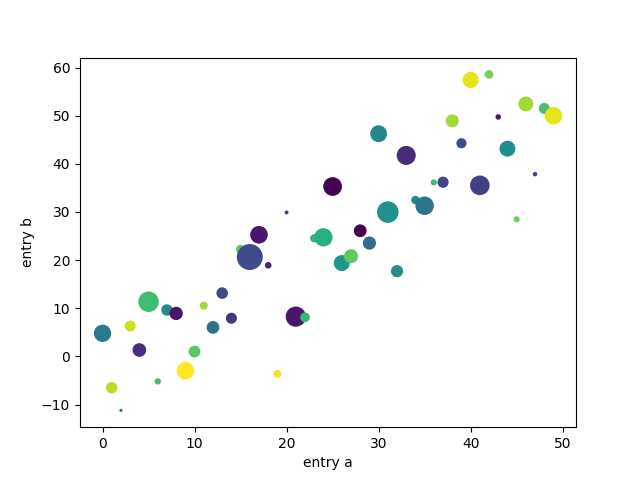
fig, ax = plt.subplots()
ax.scatter('a', 'b', c='c', s='d', data=data)
ax.set(xlabel='entry a', ylabel='entry b')
plt.show()