注意
前往末尾下載完整範例程式碼。
圖例指南#
本圖例指南擴展了 legend 的 docstring - 請在繼續閱讀本指南之前先閱讀它。
本指南使用了一些常見術語,在此處記錄以求清晰
- 圖例條目#
圖例由一個或多個圖例條目組成。一個條目由一個鍵和一個標籤組成。
- 圖例鍵#
每個圖例標籤左側的彩色/圖案標記。
- 圖例標籤#
描述由鍵表示的控制代碼的文字。
- 圖例控制代碼#
用於在圖例中產生適當條目的原始物件。
控制圖例條目#
呼叫 legend() 時不帶任何引數,會自動提取圖例控制代碼及其相關聯的標籤。此功能等同於
get_legend_handles_labels() 函數會返回一個存在於座標軸上的控制代碼/藝術家列表,可用於為生成的圖例產生條目 - 然而,值得注意的是,並非所有藝術家都可以新增到圖例中,此時必須建立「代理」(proxy) (請參閱專門為新增到圖例而建立的藝術家 (又名 代理藝術家)以取得更多詳細資訊)。
注意
標籤為空字串或標籤以底線「_」開頭的藝術家將被忽略。
為了完全控制要新增到圖例的內容,通常會將適當的控制代碼直接傳遞給 legend()
重新命名圖例條目#
當無法直接在控制代碼上設定標籤時,可以將它們直接傳遞給 Axes.legend
如果無法直接存取控制代碼,例如在使用某些第三方套件時,可以透過 Axes.get_legend_handles_labels 來存取。在此,我們使用字典來重新命名現有的標籤
專門為新增到圖例而建立的藝術家 (又名 代理藝術家)#
並非所有控制代碼都可以自動轉換為圖例條目,因此通常需要建立一個可以的藝術家。圖例控制代碼不必存在於圖形或座標軸上即可使用。
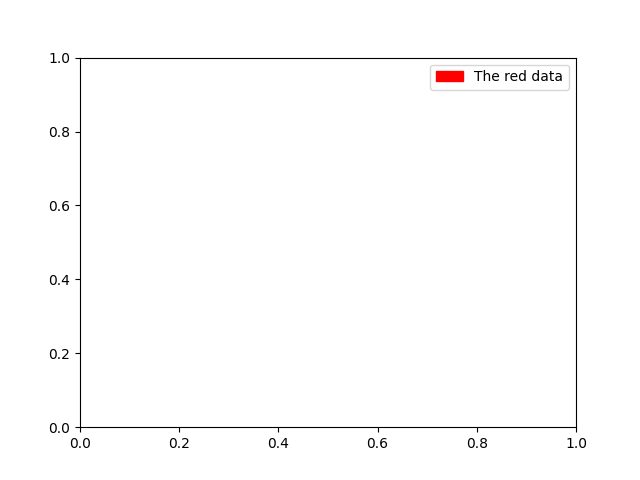
假設我們想要建立一個圖例,其中包含一些以紅色表示的資料條目
import matplotlib.pyplot as plt

import matplotlib.patches as mpatches

fig, ax = plt.subplots()
red_patch = mpatches.Patch(color='red', label='The red data')
ax.legend(handles=[red_patch])

plt.show()
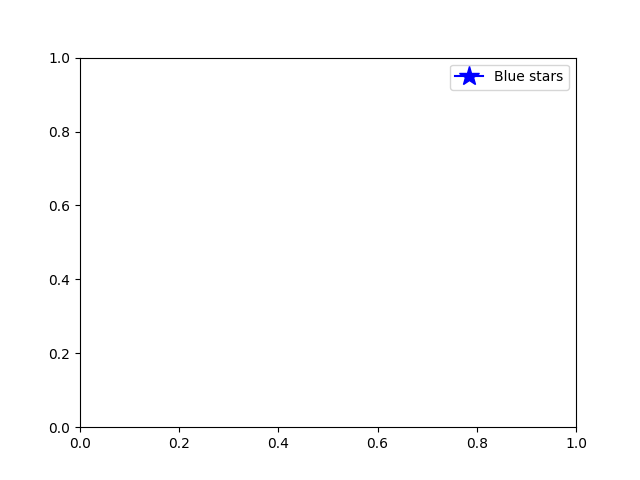
有許多支援的圖例控制代碼。我們也可以建立帶有標記的線條,而不是建立一個色塊
import matplotlib.lines as mlines

fig, ax = plt.subplots()
blue_line = mlines.Line2D([], [], color='blue', marker='*',
                          markersize=15, label='Blue stars')
ax.legend(handles=[blue_line])

plt.show()
圖例位置#
圖例的位置可以由關鍵字引數 loc 指定。如需更多詳細資訊,請參閱 legend() 的文件。
bbox_to_anchor 關鍵字為手動圖例放置提供了極大的控制程度。例如,如果您希望將座標軸圖例放在圖形的右上角,而不是座標軸的角落,只需指定角落的位置以及該位置的座標系統即可
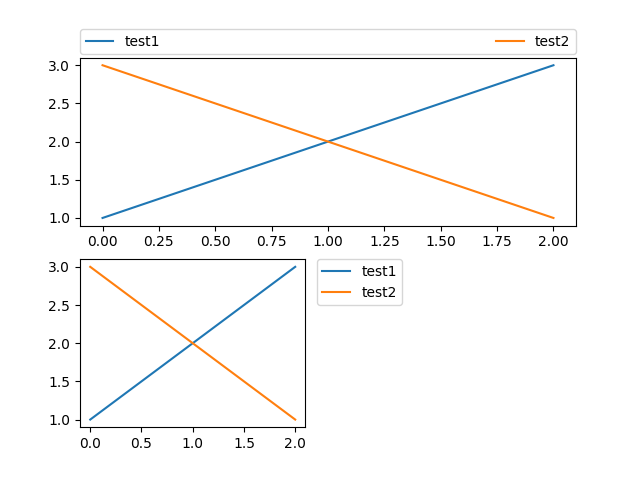
更多自訂圖例放置的範例
fig, ax_dict = plt.subplot_mosaic([['top', 'top'], ['bottom', 'BLANK']],
                                  empty_sentinel="BLANK")
ax_dict['top'].plot([1, 2, 3], label="test1")
ax_dict['top'].plot([3, 2, 1], label="test2")
# Place a legend above this subplot, expanding itself to
# fully use the given bounding box.
ax_dict['top'].legend(bbox_to_anchor=(0., 1.02, 1., .102), loc='lower left',
                      ncols=2, mode="expand", borderaxespad=0.)

ax_dict['bottom'].plot([1, 2, 3], label="test1")
ax_dict['bottom'].plot([3, 2, 1], label="test2")
# Place a legend to the right of this smaller subplot.
ax_dict['bottom'].legend(bbox_to_anchor=(1.05, 1),
                         loc='upper left', borderaxespad=0.)
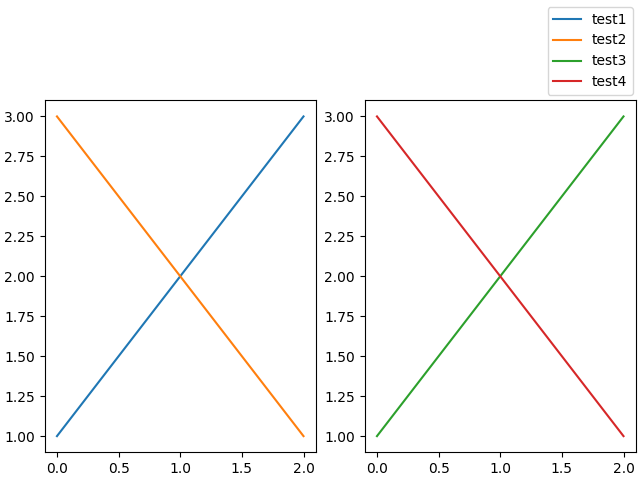
圖形圖例#
有時將圖例放置在相對於 (子) 圖形而不是個別座標軸上更有意義。透過使用約束佈局,並在 loc 關鍵字引數的開頭指定「outside」,圖例將繪製在 (子) 圖形上座標軸的外部。
fig, axs = plt.subplot_mosaic([['left', 'right']], layout='constrained')

axs['left'].plot([1, 2, 3], label="test1")
axs['left'].plot([3, 2, 1], label="test2")

axs['right'].plot([1, 2, 3], 'C2', label="test3")
axs['right'].plot([3, 2, 1], 'C3', label="test4")
# Place a legend to the right of this smaller subplot.
fig.legend(loc='outside upper right')
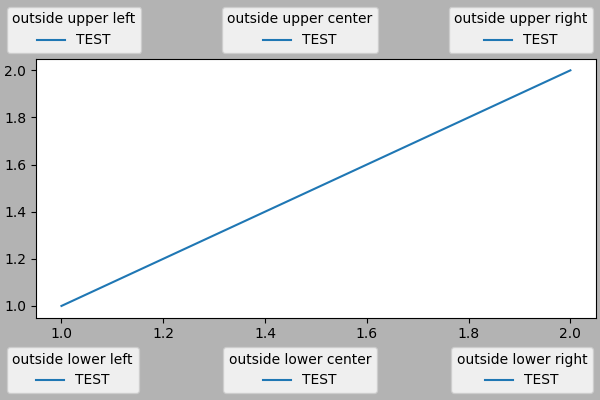
這接受與一般的 loc 關鍵字略有不同的語法,「outside right upper」與「outside upper right」不同。
ucl = ['upper', 'center', 'lower']
lcr = ['left', 'center', 'right']
fig, ax = plt.subplots(figsize=(6, 4), layout='constrained', facecolor='0.7')
ax.plot([1, 2], [1, 2], label='TEST')
# Place a legend to the right of this smaller subplot.
for loc in [
'outside upper left',
'outside upper center',
'outside upper right',
'outside lower left',
'outside lower center',
'outside lower right']:
fig.legend(loc=loc, title=loc)
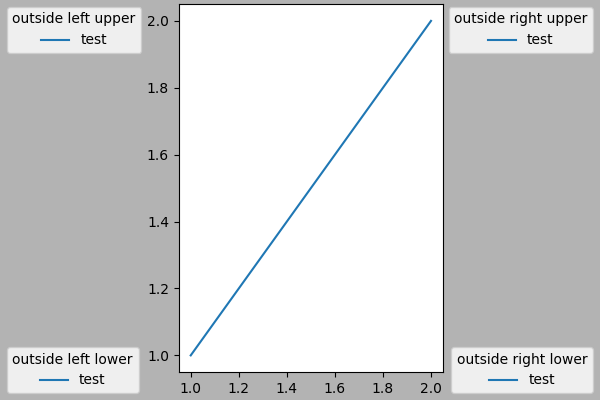
fig, ax = plt.subplots(figsize=(6, 4), layout='constrained', facecolor='0.7')
ax.plot([1, 2], [1, 2], label='test')
for loc in [
'outside left upper',
'outside right upper',
'outside left lower',
'outside right lower']:
fig.legend(loc=loc, title=loc)
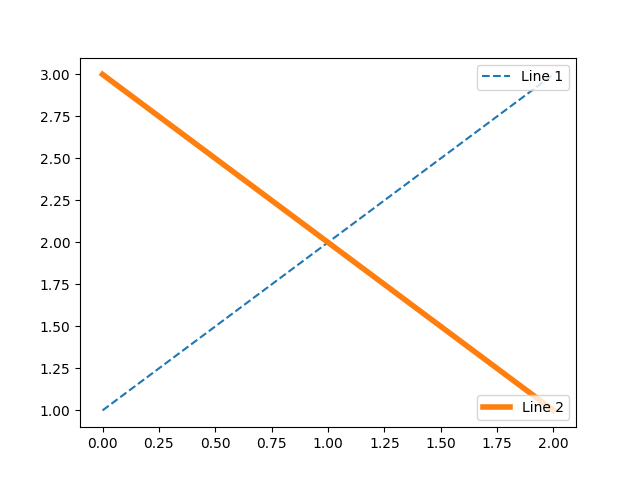
同一座標軸上的多個圖例#
有時將圖例條目拆分到多個圖例中會更清楚。雖然這樣做的直覺方法可能是多次呼叫 legend() 函數,但您會發現座標軸上只存在一個圖例。這樣做的目的是為了可以重複呼叫 legend(),以將圖例更新為座標軸上的最新控制代碼。為了保留舊的圖例實例,我們必須手動將它們新增到座標軸
fig, ax = plt.subplots()
line1, = ax.plot([1, 2, 3], label="Line 1", linestyle='--')
line2, = ax.plot([3, 2, 1], label="Line 2", linewidth=4)

# Create a legend for the first line.
first_legend = ax.legend(handles=[line1], loc='upper right')

# Add the legend manually to the Axes.
ax.add_artist(first_legend)

# Create another legend for the second line.
ax.legend(handles=[line2], loc='lower right')

plt.show()
圖例處理常式#
為了建立圖例條目,控制代碼會作為適當的 HandlerBase 子類別的引數提供。處理常式子類別的選擇由以下規則決定
使用
handler_map關鍵字中的值更新get_legend_handler_map()。檢查
handle是否在新建立的handler_map中。檢查
handle的類型是否在新建立的handler_map中。檢查
handle的 mro 中的任何類型是否在新建立的handler_map中。
為了完整起見,此邏輯主要在 get_legend_handler() 中實作。
所有這些彈性意味著我們擁有為我們自己類型的圖例鍵實作自訂處理常式所需的掛鉤。
使用自訂處理常式最簡單的範例是實例化現有的 legend_handler.HandlerBase 子類別之一。為了簡單起見,讓我們選擇 legend_handler.HandlerLine2D,它接受 numpoints 引數 (numpoints 也是為了方便起見,在 legend() 函數上的關鍵字)。然後,我們可以將實例到處理常式的對應作為關鍵字傳遞給圖例。
from matplotlib.legend_handler import HandlerLine2D

fig, ax = plt.subplots()
line1, = ax.plot([3, 2, 1], marker='o', label='Line 1')
line2, = ax.plot([1, 2, 3], marker='o', label='Line 2')

ax.legend(handler_map={line1: HandlerLine2D(numpoints=4)}, handlelength=4)
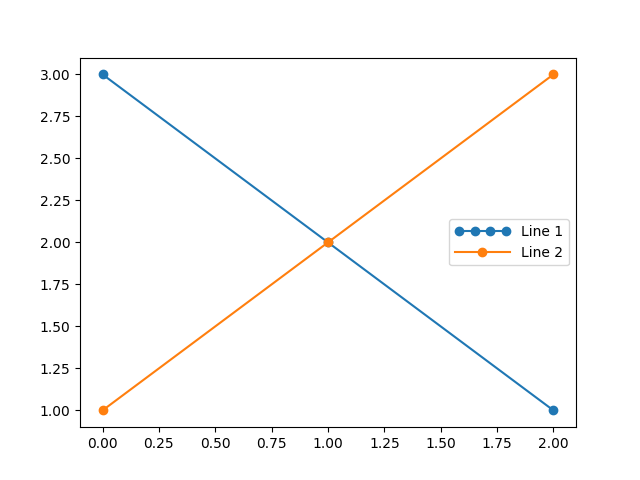
如您所見,「Line 1」現在有 4 個標記點,而「Line 2」有 2 個 (預設值)。我們還使用 handlelength 關鍵字增加了控制代碼的長度,以適應較大的圖例條目。請嘗試上述程式碼,只將地圖的鍵從 line1 變更為 type(line1)。請注意,現在兩個 Line2D 實例都獲得了 4 個標記。
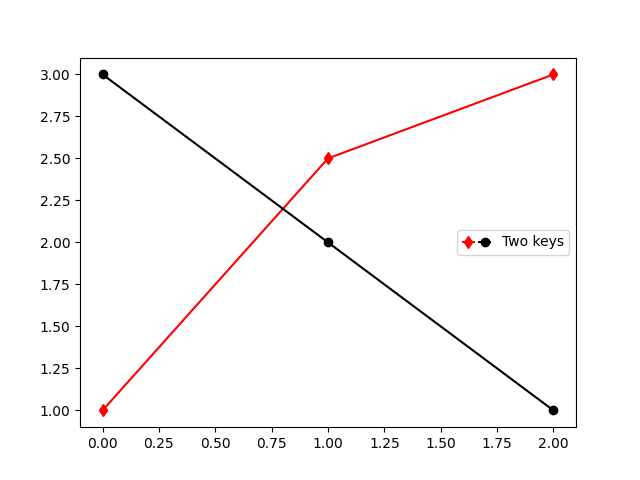
除了處理如誤差條、莖狀圖和直方圖等複雜圖表類型的處理器之外,預設的 handler_map 還有一個特殊的 tuple 處理器 (legend_handler.HandlerTuple),它只是將給定 tuple 中每個項目的圖示疊加在一起繪製。以下範例示範如何將兩個圖例鍵疊加在一起。
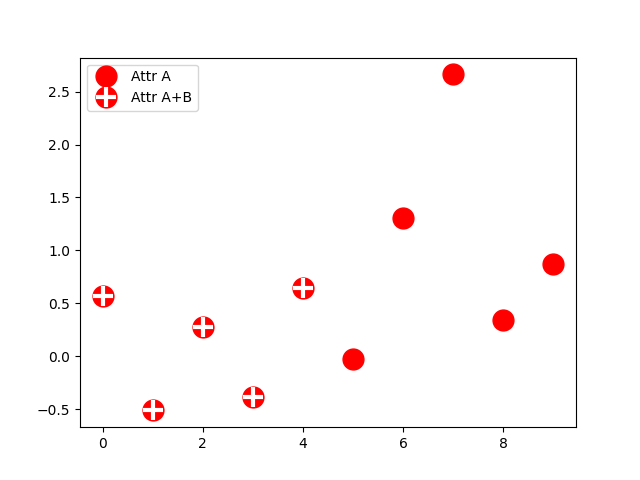
legend_handler.HandlerTuple 類別也可以用於將多個圖例鍵分配給同一個條目。
from matplotlib.legend_handler import HandlerLine2D, HandlerTuple

fig, ax = plt.subplots()
p1, = ax.plot([1, 2.5, 3], 'r-d')
p2, = ax.plot([3, 2, 1], 'k-o')

l = ax.legend([(p1, p2)], ['Two keys'], numpoints=1,
              handler_map={tuple: HandlerTuple(ndivide=None)})
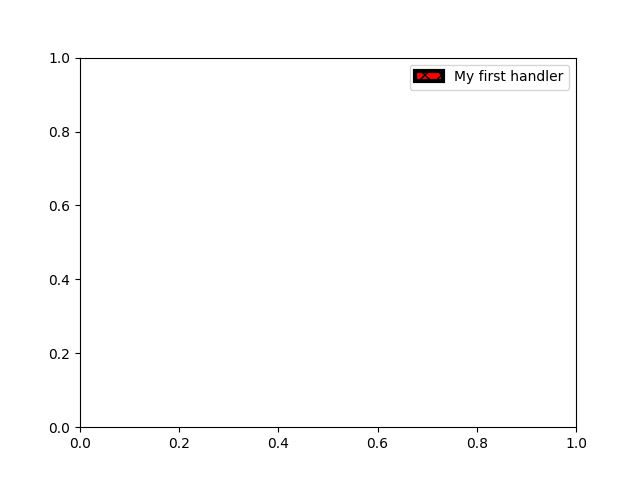
實作自訂圖例處理器#
可以實作自訂處理器,將任何圖示轉換為圖例鍵(圖示不一定需要是 matplotlib 的 artist)。處理器必須實作一個 legend_artist 方法,該方法會回傳一個供圖例使用的單一 artist。 legend_artist 的必要簽名記錄在 legend_artist。
import matplotlib.patches as mpatches


class AnyObject:
    pass


class AnyObjectHandler:
    def legend_artist(self, legend, orig_handle, fontsize, handlebox):
        x0, y0 = handlebox.xdescent, handlebox.ydescent
        width, height = handlebox.width, handlebox.height
        patch = mpatches.Rectangle([x0, y0], width, height, facecolor='red',
                                   edgecolor='black', hatch='xx', lw=3,
                                   transform=handlebox.get_transform())
        handlebox.add_artist(patch)
        return patch

fig, ax = plt.subplots()

ax.legend([AnyObject()], ['My first handler'],
          handler_map={AnyObject: AnyObjectHandler()})
或者,如果我們想要全域接受 AnyObject 實例,而不需要一直手動設定 *handler_map* 關鍵字,我們可以將新的處理器註冊為:
from matplotlib.legend import Legend
Legend.update_default_handler_map({AnyObject: AnyObjectHandler()})
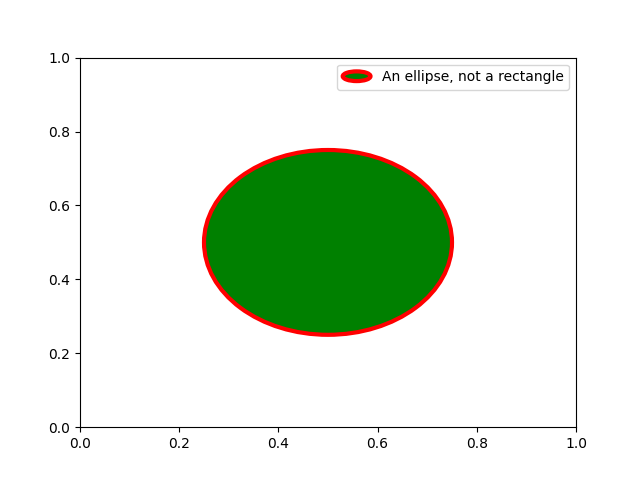
雖然這裡的功能很清楚,但請記住,已經實作了許多處理器,而且您想要實現的目標可能已經可以透過現有類別輕鬆達成。例如,要產生橢圓形的圖例鍵,而不是矩形的圖例鍵:
from matplotlib.legend_handler import HandlerPatch


class HandlerEllipse(HandlerPatch):
    def create_artists(self, legend, orig_handle,
                       xdescent, ydescent, width, height, fontsize, trans):
        center = 0.5 * width - 0.5 * xdescent, 0.5 * height - 0.5 * ydescent
        p = mpatches.Ellipse(xy=center, width=width + xdescent,
                             height=height + ydescent)
        self.update_prop(p, orig_handle, legend)
        p.set_transform(trans)
        return [p]


c = mpatches.Circle((0.5, 0.5), 0.25, facecolor="green",
                    edgecolor="red", linewidth=3)

fig, ax = plt.subplots()

ax.add_patch(c)
ax.legend([c], ["An ellipse, not a rectangle"],
          handler_map={mpatches.Circle: HandlerEllipse()})
腳本總執行時間: (0 分鐘 7.292 秒)