Matplotlib 應用程式介面 (API)#
Matplotlib 有兩個主要的應用程式介面,或使用函式庫的樣式
一個明確的「軸 (Axes)」介面,它使用圖表或軸物件上的方法來建立其他藝術家,並逐步建構視覺化。這也稱為「物件導向」介面。
一個隱含的「pyplot」介面,它會追蹤最後建立的圖表和軸,並將藝術家新增到它認為使用者想要的物件。
此外,許多下游函式庫 (例如 pandas 和 xarray) 在它們的資料類別上直接提供實作的 plot 方法,以便使用者可以呼叫 data.plot()。
這些介面之間的差異可能會讓人感到有些困惑,特別是網路上使用其中一種或另一種,有時甚至在同一個範例中使用多個介面的程式碼片段。在這裡,我們嘗試指出「pyplot」和下游介面如何與明確的「軸」介面相關聯,以幫助使用者更好地瀏覽函式庫。
原生 Matplotlib 介面#
明確的「軸」介面#
「軸」介面是 Matplotlib 的實作方式,許多自訂和微調最終都會在這個層級完成。
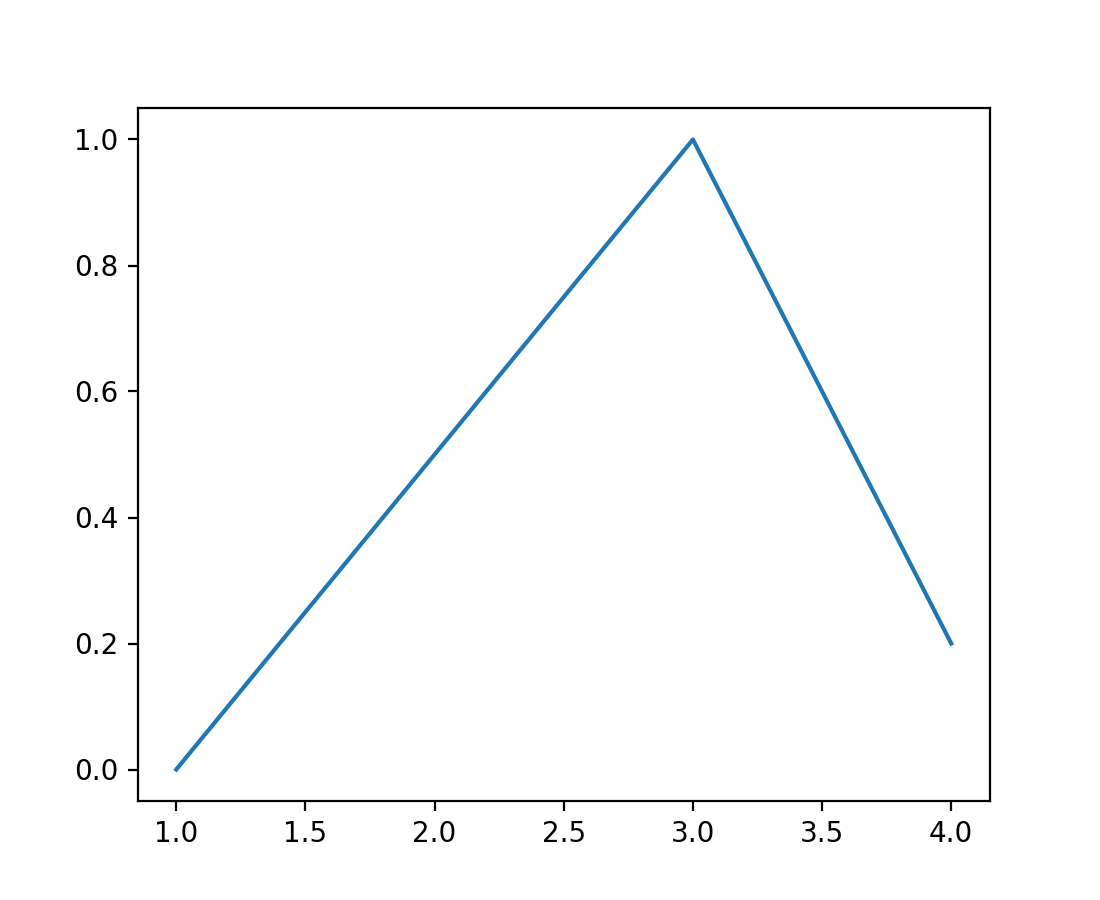
此介面的運作方式是實例化 Figure 類別 (下面的 fig) 的實例,使用該物件上的 subplots 方法 (或類似方法) 來建立一個或多個 Axes 物件 (下面的 ax),然後在軸上呼叫繪圖方法 (在本範例中為 plot)
import matplotlib.pyplot as plt

fig = plt.figure()
ax = fig.subplots()
ax.plot([1, 2, 3, 4], [0, 0.5, 1, 0.2])

我們稱此為「明確」介面,因為每個物件都被明確參考,並用於建立下一個物件。保留對物件的參考非常靈活,並且允許我們在物件建立後但在顯示之前自訂物件。
隱含的「pyplot」介面#
pyplot 模組會遮蔽大多數的 Axes 繪圖方法,以提供與上述相同的效果,其中圖表和軸的建立是為使用者完成的
import matplotlib.pyplot as plt

plt.plot([1, 2, 3, 4], [0, 0.5, 1, 0.2])
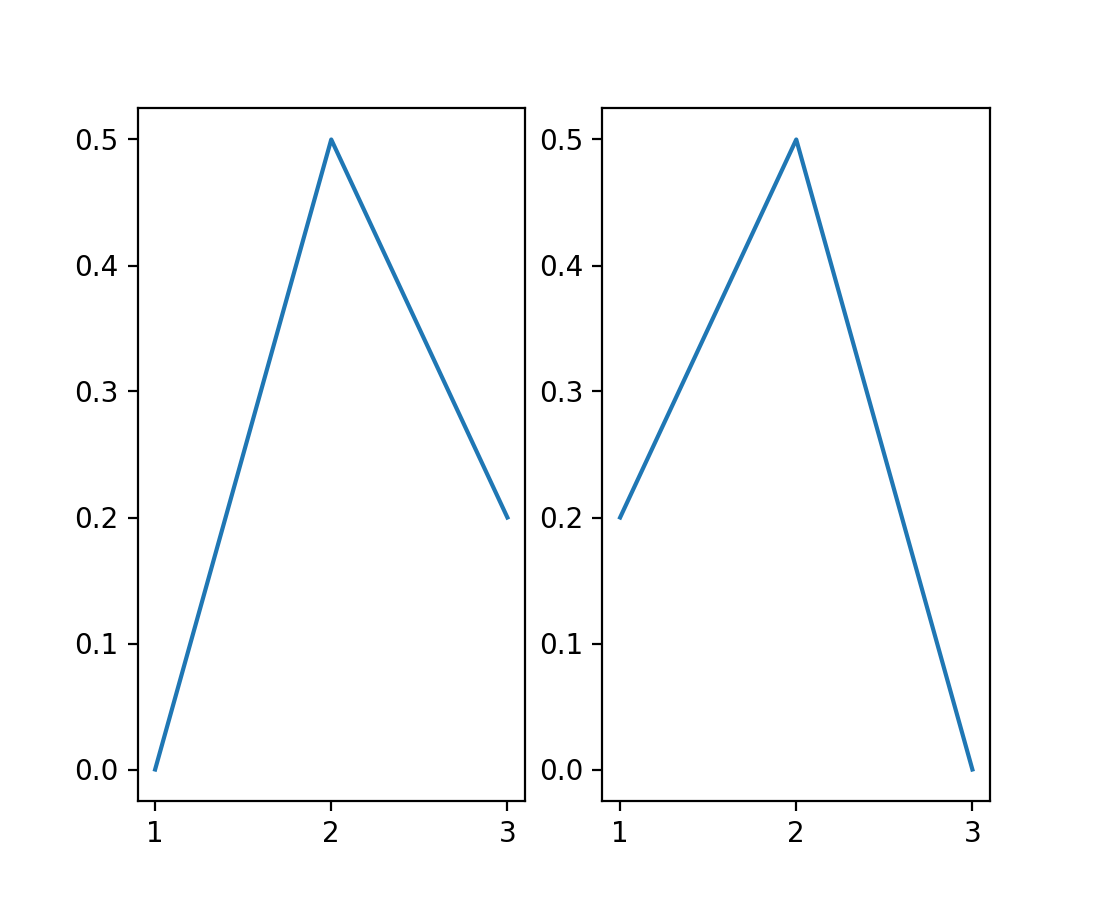
這可能會很方便,尤其是在進行互動工作或簡單的腳本時。可以使用 gcf 來擷取對目前圖表的參考,並使用 gca 來擷取對目前軸的參考。pyplot 模組會為使用者保留一個圖表清單,而每個圖表都會保留一個圖表上的軸清單,因此以下程式碼
import matplotlib.pyplot as plt

plt.subplot(1, 2, 1)
plt.plot([1, 2, 3], [0, 0.5, 0.2])

plt.subplot(1, 2, 2)
plt.plot([3, 2, 1], [0, 0.5, 0.2])

等效於
import matplotlib.pyplot as plt

plt.subplot(1, 2, 1)
ax = plt.gca()
ax.plot([1, 2, 3], [0, 0.5, 0.2])

plt.subplot(1, 2, 2)
ax = plt.gca()
ax.plot([3, 2, 1], [0, 0.5, 0.2])

在明確介面中,這將是
import matplotlib.pyplot as plt

fig, axs = plt.subplots(1, 2)
axs[0].plot([1, 2, 3], [0, 0.5, 0.2])
axs[1].plot([3, 2, 1], [0, 0.5, 0.2])
在軸介面和 pyplot 介面之間轉換#
您可能會在現有程式碼中找到任一介面,甚至不幸的是有時會找到混合使用的情況。本節說明兩個介面中特定操作的模式,以及如何從一個介面轉換到另一個介面。
建立圖表對於兩個介面都是相同的:使用各自的
pyplot函式plt.figure()、plt.subplots()、plt.subplot_mosaic()。對於軸介面,您通常會將建立的圖表 (以及可能的軸) 儲存在變數中以供稍後使用。當使用 pyplot 介面時,這些值通常不會儲存。範例軸:
fig, ax = plt.subplots()pyplot:
plt.subplots()
「繪圖」函式,即新增資料的函式,在軸和 pyplot 中名稱相同,且參數也相同。範例
軸:
ax.plot(x, y)pyplot:
plt.plot(x, y)
在 Axes 上,用於檢索屬性的函式名稱與 pyplot 中的屬性名稱相同,並加上
get_前綴。範例:Axes:
label = ax.get_xlabel()pyplot:
label = plt.xlabel()
在 Axes 上,用於設定屬性的函式名稱與 pyplot 中的屬性名稱相同,並加上
set_前綴。範例:Axes:
ax.set_xlabel("time")pyplot:
plt.xlabel("time")
以下是範例的簡短摘要,以並排比較的方式呈現:
操作 |
Axes 介面 |
pyplot 介面 |
|---|---|---|
建立圖形 |
|
|
繪製資料 |
|
|
取得屬性 |
|
|
設定屬性 |
|
|
為何要明確?#
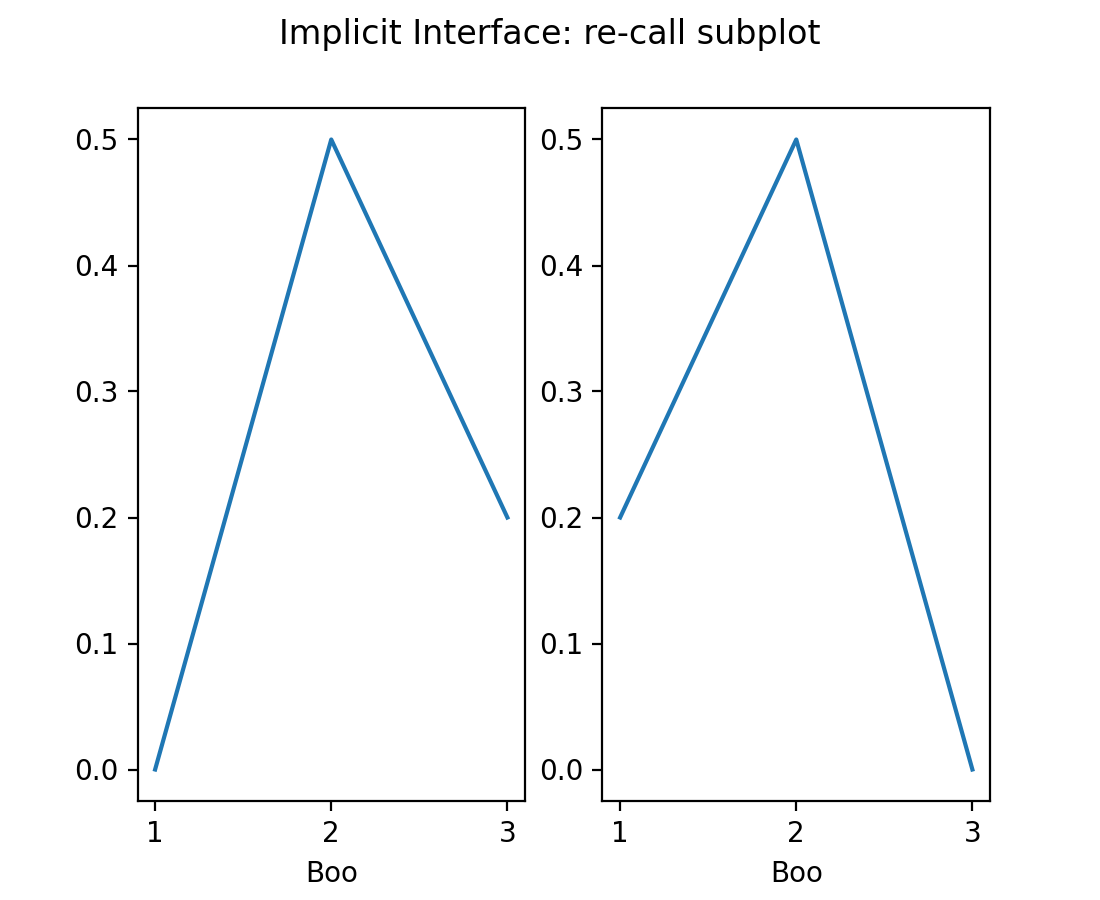
如果您需要回溯並操作一個沒有被 plt.gca() 參照的舊軸 (axes) 時會發生什麼事?一個簡單的方法是使用相同的參數再次呼叫 subplot。然而,這很快就會變得不夠優雅。您也可以檢查 Figure 物件並取得其 Axes 物件的列表,但是,這可能會產生誤導(顏色條也是 Axes!)。最好的解決方案可能是儲存您建立的每個 Axes 的控制代碼,但是,如果您這樣做了,為什麼不直接在開始時建立所有 Axes 物件呢?
第一種方法是再次呼叫 plt.subplot
import matplotlib.pyplot as plt

plt.subplot(1, 2, 1)
plt.plot([1, 2, 3], [0, 0.5, 0.2])

plt.subplot(1, 2, 2)
plt.plot([3, 2, 1], [0, 0.5, 0.2])

plt.suptitle('Implicit Interface: re-call subplot')

for i in range(1, 3):
    plt.subplot(1, 2, i)
    plt.xlabel('Boo')
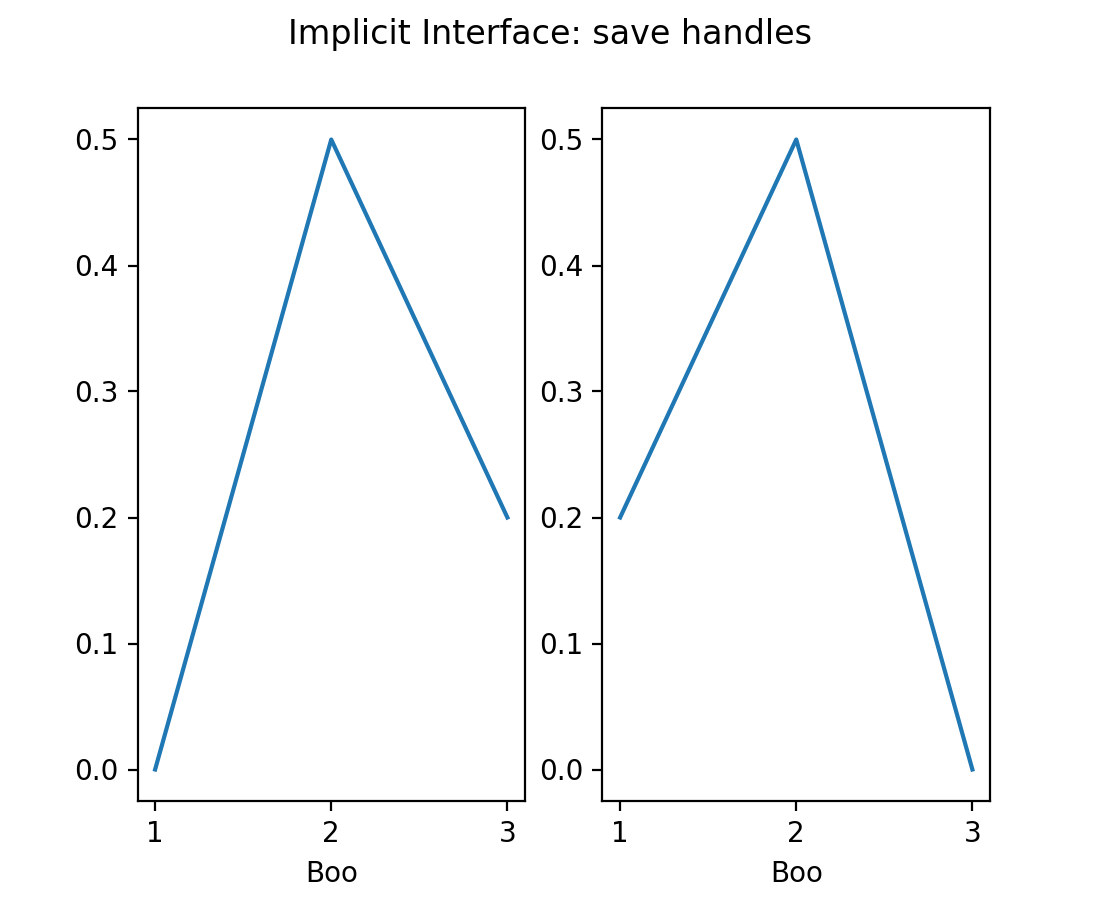
第二種是儲存控制代碼
import matplotlib.pyplot as plt

axs = []
ax = plt.subplot(1, 2, 1)
axs += [ax]
plt.plot([1, 2, 3], [0, 0.5, 0.2])

ax = plt.subplot(1, 2, 2)
axs += [ax]
plt.plot([3, 2, 1], [0, 0.5, 0.2])

plt.suptitle('Implicit Interface: save handles')

for i in range(2):
    plt.sca(axs[i])
    plt.xlabel('Boo')
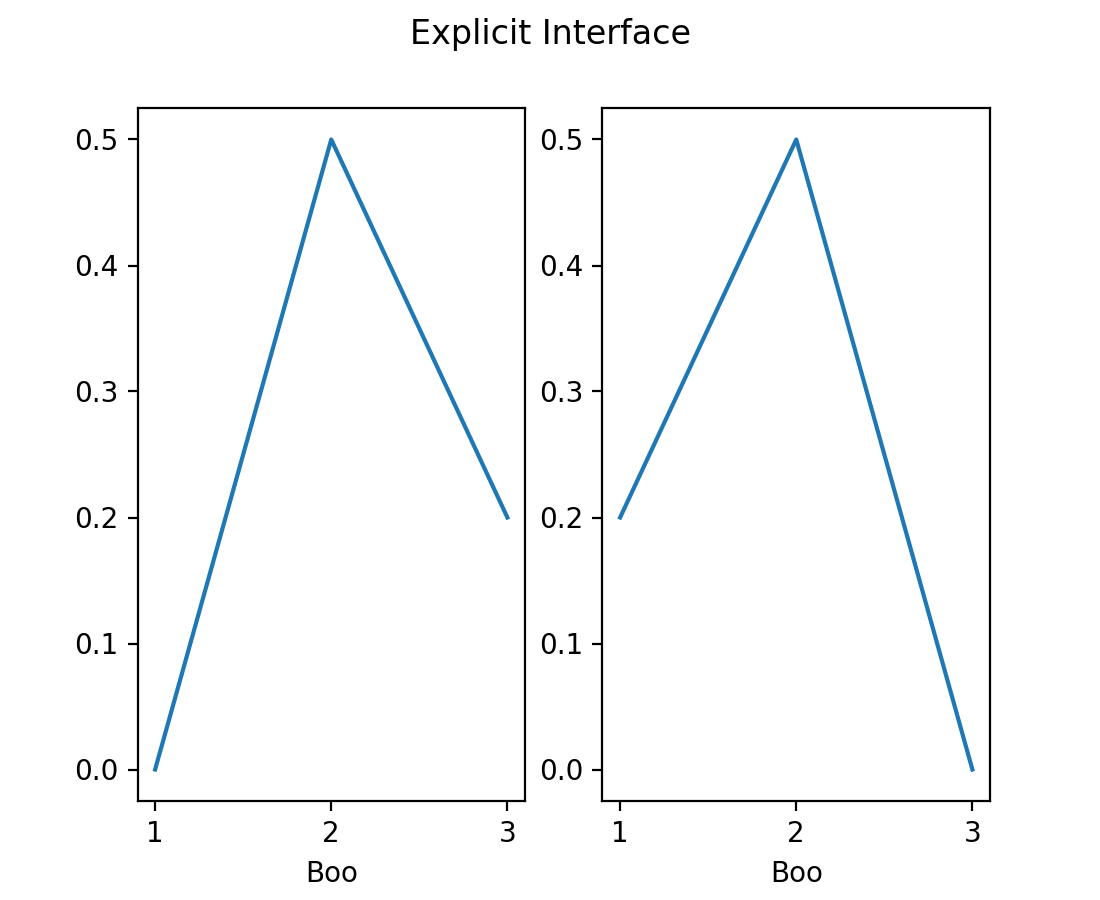
然而,建議的方式是從一開始就明確指定
import matplotlib.pyplot as plt

fig, axs = plt.subplots(1, 2)
axs[0].plot([1, 2, 3], [0, 0.5, 0.2])
axs[1].plot([3, 2, 1], [0, 0.5, 0.2])
fig.suptitle('Explicit Interface')
for i in range(2):
    axs[i].set_xlabel('Boo')
第三方函式庫「資料物件」介面#
某些第三方函式庫選擇為其資料物件實作繪圖功能,例如在 pandas、xarray 和其他第三方函式庫中看到的 data.plot()。為了說明起見,下游函式庫可以實作一個簡單的資料容器,其中一起儲存 x 和 y 資料,然後實作 plot 方法
import matplotlib.pyplot as plt

# supplied by downstream library:
class DataContainer:

    def __init__(self, x, y):
        """
        Proper docstring here!
        """
        self._x = x
        self._y = y

    def plot(self, ax=None, **kwargs):
        if ax is None:
            ax = plt.gca()
        ax.plot(self._x, self._y, **kwargs)
        ax.set_title('Plotted from DataClass!')
        return ax


# what the user usually calls:
data = DataContainer([0, 1, 2, 3], [0, 0.2, 0.5, 0.3])
data.plot()
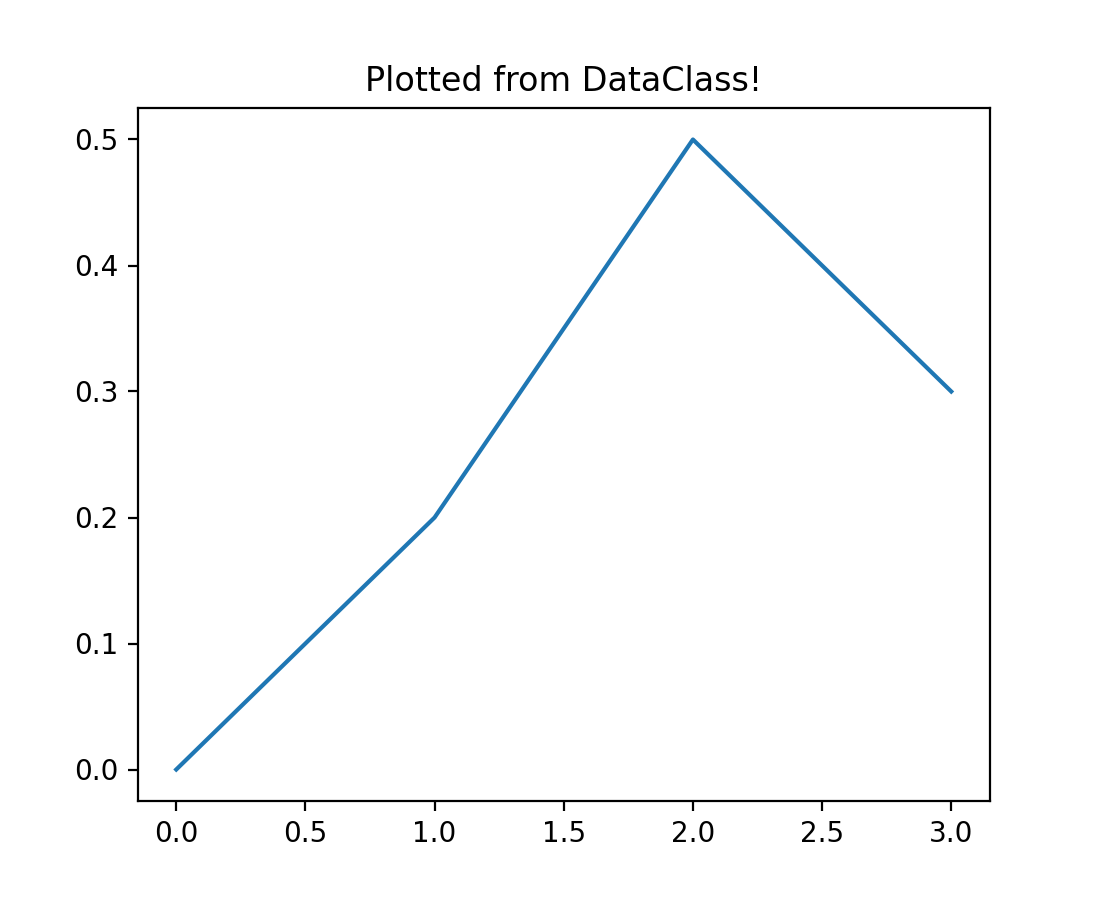
因此,函式庫可以向使用者隱藏所有細節,並可以針對資料類型製作適當的可視化圖表,通常具有良好的標籤、色彩映射選擇和其他便利的功能。
然而,在以上範例中,我們可能不喜歡函式庫提供的標題。值得慶幸的是,它們將 plot() 方法中的 Axes 傳回給我們,並且理解明確的 Axes 介面後,我們可以呼叫:ax.set_title('My preferred title') 來客製化標題。
許多函式庫也允許它們的 plot 方法接受一個可選的 *ax* 引數。這讓我們可以將可視化圖表放置在我們已放置並可能客製化的 Axes 中。
摘要#
總體而言,了解明確的「Axes」介面很有用,因為它是最靈活的,並且是其他介面的基礎。使用者通常可以找出如何降級到明確的介面並操作底層物件。雖然明確的介面在設定上可能稍微冗長一些,但複雜的圖表通常會比嘗試使用隱含的「pyplot」介面更簡單。
注意
有時人們會感到困惑,因為我們為兩個介面都匯入了 pyplot。目前,pyplot 模組實作了「pyplot」介面,但它也提供了頂層的 Figure 和 Axes 建立方法,並且如果正在使用,最終會啟動圖形使用者介面。因此,無論選擇哪個介面,仍然需要 pyplot。
同樣地,合作夥伴函式庫提供的宣告式介面會使用「Axes」介面可存取的物件,並且通常會將這些物件作為引數接受,或從方法中傳回這些物件。通常必須使用明確的「Axes」介面來執行預設視覺效果的任何客製化,或將資料解壓縮到 NumPy 陣列並直接傳遞給 Matplotlib。
附錄:「Axes」介面與資料結構#
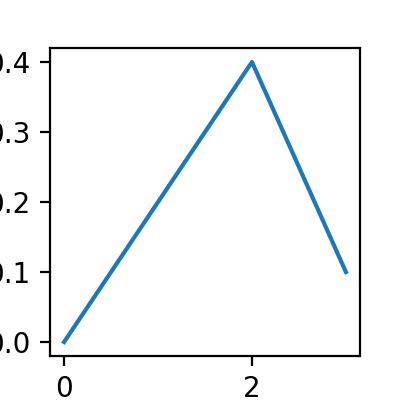
大多數 Axes 方法允許透過將 *data* 物件傳遞給方法並將引數指定為字串來使用另一個 API 尋址
import matplotlib.pyplot as plt

data = {'xdat': [0, 1, 2, 3], 'ydat': [0, 0.2, 0.4, 0.1]}
fig, ax = plt.subplots(figsize=(2, 2))
ax.plot('xdat', 'ydat', data=data)
附錄:「pylab」介面#
還有一個更不建議使用的介面,基本上就是執行 from matplotlib.pylab import *。這會將 matplotlib.pyplot、numpy、numpy.fft、numpy.linalg 和 numpy.random 中的所有函式以及一些其他函式匯入全域命名空間。
這種模式在現代 Python 中被認為是不好的做法,因為它會使全域命名空間混亂。更嚴重的是,在 pylab 的情況下,這會覆寫一些內建函式(例如,內建的 sum 將被 numpy.sum 取代),這可能會導致意外行為。