藝術家簡介#
您在 Matplotlib 圖表上互動的幾乎所有物件都稱為「藝術家」(Artist) (並且是 Artist 類別的子類別)。圖表和軸是藝術家,通常包含Axis藝術家和包含資料或註釋資訊的藝術家。
建立藝術家#
通常我們不會直接實例化藝術家,而是使用Axes上的繪圖方法。以下提供一些繪圖方法和它們建立的藝術家物件範例
軸輔助方法 |
藝術家 |
|---|---|
|
|
|
|
|
|
|
|
|
|
|
|
|
|
|
|
|
|
|
舉例來說,我們可以儲存從 axes.Axes.plot 返回的 Line2D 藝術家
In [209]: import matplotlib.pyplot as plt
In [210]: import matplotlib.artist as martist
In [211]: import numpy as np

In [212]: fig, ax = plt.subplots()
In [213]: x, y = np.random.rand(2, 100)
In [214]: lines = ax.plot(x, y, '-', label='example')
In [215]: print(lines)
[<matplotlib.lines.Line2D at 0xd378b0c>]
請注意,plot 返回的是線條的 _清單_,因為您可以傳入多個 x、y 配對來繪製圖表。該線條已新增至軸,我們可以透過 get_lines() 擷取藝術家
In [216]: print(ax.get_lines())
<a list of 1 Line2D objects>
In [217]: print(ax.get_lines()[0])
Line2D(example)
變更藝術家屬性#
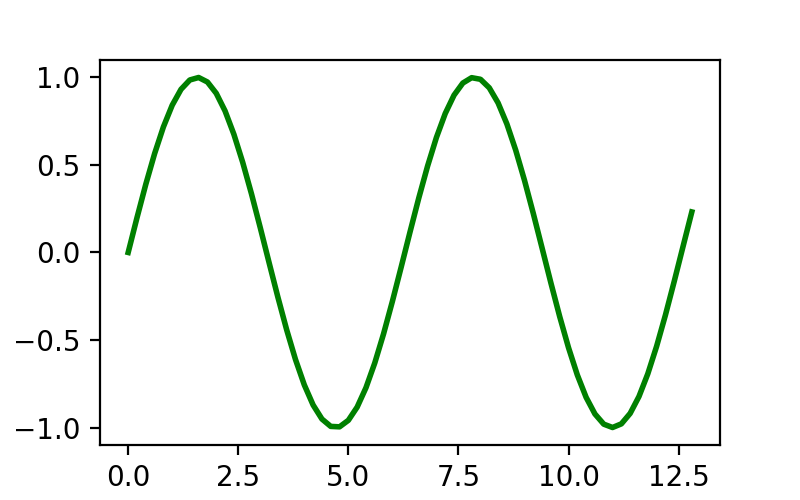
取得 lines 物件可讓我們存取 Line2D 物件的所有屬性。因此,如果我們事後想要變更 _線寬_,可以使用 Artist.set 來進行。
fig, ax = plt.subplots(figsize=(4, 2.5))
x = np.arange(0, 13, 0.2)
y = np.sin(x)
lines = ax.plot(x, y, '-', label='example', linewidth=0.2, color='blue')
lines[0].set(color='green', linewidth=2)
我們可以使用 matplotlib.artist.getp 查詢可設定屬性的完整清單
In [218]: martist.getp(lines[0])
agg_filter = None
alpha = None
animated = False
antialiased or aa = True
bbox = Bbox(x0=0.004013842290585101, y0=0.013914221641967...
children = []
clip_box = TransformedBbox(     Bbox(x0=0.0, y0=0.0, x1=1.0, ...
clip_on = True
clip_path = None
color or c = blue
dash_capstyle = butt
dash_joinstyle = round
data = (array([0.91377845, 0.58456834, 0.36492019, 0.0379...
drawstyle or ds = default
figure = Figure(550x450)
fillstyle = full
gapcolor = None
gid = None
in_layout = True
label = example
linestyle or ls = -
linewidth or lw = 2.0
marker = None
markeredgecolor or mec = blue
markeredgewidth or mew = 1.0
markerfacecolor or mfc = blue
markerfacecoloralt or mfcalt = none
markersize or ms = 6.0
markevery = None
mouseover = False
path = Path(array([[0.91377845, 0.51224793],        [0.58...
path_effects = []
picker = None
pickradius = 5
rasterized = False
sketch_params = None
snap = None
solid_capstyle = projecting
solid_joinstyle = round
tightbbox = Bbox(x0=70.4609002763619, y0=54.321277798941786, x...
transform = CompositeGenericTransform(     TransformWrapper(  ...
transformed_clip_path_and_affine = (None, None)
url = None
visible = True
window_extent = Bbox(x0=70.4609002763619, y0=54.321277798941786, x...
xdata = [0.91377845 0.58456834 0.36492019 0.03796664 0.884...
xydata = [[0.91377845 0.51224793]  [0.58456834 0.9820474 ] ...
ydata = [0.51224793 0.9820474  0.24469912 0.61647032 0.483...
zorder = 2
請注意,大多數藝術家也都有不同的設定器清單;例如,Line2D.set_color 或 Line2D.set_linewidth。
變更藝術家資料#
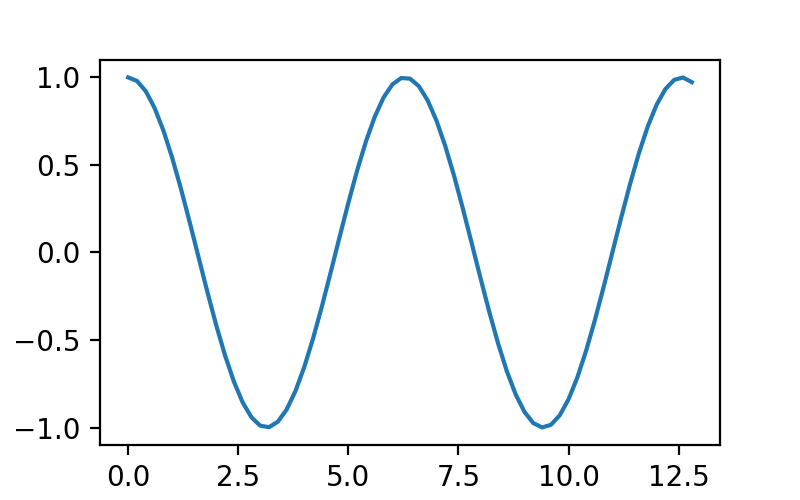
除了 _色彩_ 和 _線寬_ 等樣式屬性之外,Line2D 物件還具有 _data_ 屬性。您可以使用 Line2D.set_data 在建立線條後設定資料。這通常用於動畫,其中會顯示同一條線條隨著時間演變(請參閱使用 Matplotlib 的動畫)
fig, ax = plt.subplots(figsize=(4, 2.5))
x = np.arange(0, 13, 0.2)
y = np.sin(x)
lines = ax.plot(x, y, '-', label='example')
lines[0].set_data([x, np.cos(x)])
手動新增藝術家#
並非所有藝術家都有輔助方法,或者您可能因為某些原因想要使用低階方法。例如,patches.Circle 藝術家沒有輔助方法,但我們仍然可以使用 axes.Axes.add_artist 方法建立並新增到軸
import matplotlib.patches as mpatches

fig, ax = plt.subplots(figsize=(4, 2.5))
circle = mpatches.Circle((0.5, 0.5), 0.25, ec="none")
ax.add_artist(circle)
clipped_circle = mpatches.Circle((1, 0.5), 0.125, ec="none", facecolor='C1')
ax.add_artist(clipped_circle)
ax.set_aspect(1)
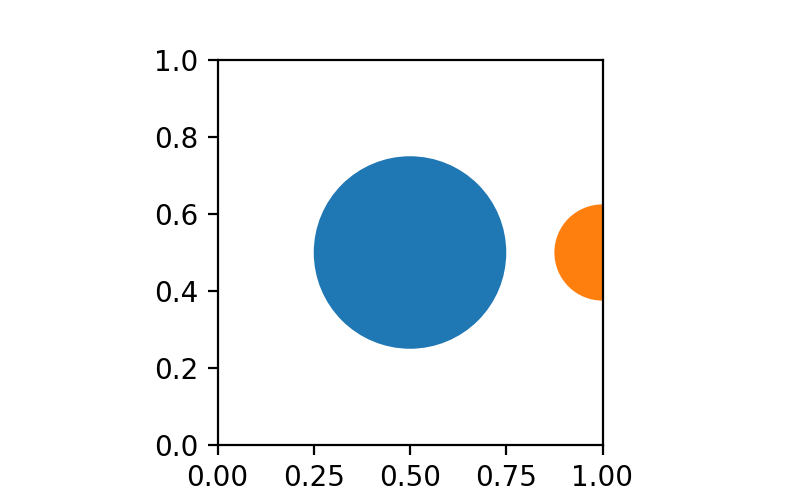
圓形會將圓形的中心和半徑作為其建構函式的引數;選用引數會以關鍵字引數的形式傳遞。
請注意,當我們像這樣手動新增一個 Artist 時,它不一定會像大多數輔助方法那樣調整軸的範圍,因此 Artist 可能會被裁剪,就像上面 clipped_circle 圖塊的情況一樣。
請參閱Matplotlib Artist 的參考資料以了解其他圖塊。
移除 Artist#
有時我們想要從圖表中移除一個 Artist,而無需從頭重新指定整個圖表。大多數 Artist 都有一個可用的 *remove* 方法,可將 Artist 從其 Axes 列表中移除。例如,lines[0].remove() 將會移除上面範例中建立的 Line2D Artist。