注意
跳至結尾下載完整的範例程式碼。
自訂顏色條教學#
本教學示範如何建立和自訂獨立的顏色條,即沒有附加繪圖的顏色條。
colorbar 需要一個「可映射的」 (matplotlib.cm.ScalarMappable) 物件(通常是影像),以指示要使用的色階圖和規範。為了建立沒有附加影像的顏色條,可以使用沒有相關資料的 ScalarMappable。
import matplotlib.pyplot as plt
import matplotlib as mpl
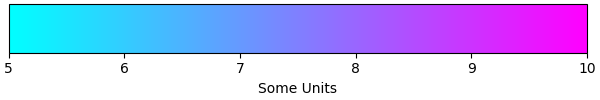
基本連續顏色條#
在此,我們建立一個帶有刻度和標籤的基本連續顏色條。
呼叫 colorbar 的參數是 ScalarMappable(使用 *norm* 和 *cmap* 參數建構)、應繪製顏色條的軸,以及顏色條的方向。
有關更多資訊,請參閱 colorbar API。
fig, ax = plt.subplots(figsize=(6, 1), layout='constrained')

cmap = mpl.cm.cool
norm = mpl.colors.Normalize(vmin=5, vmax=10)

fig.colorbar(mpl.cm.ScalarMappable(norm=norm, cmap=cmap),
             cax=ax, orientation='horizontal', label='Some Units')
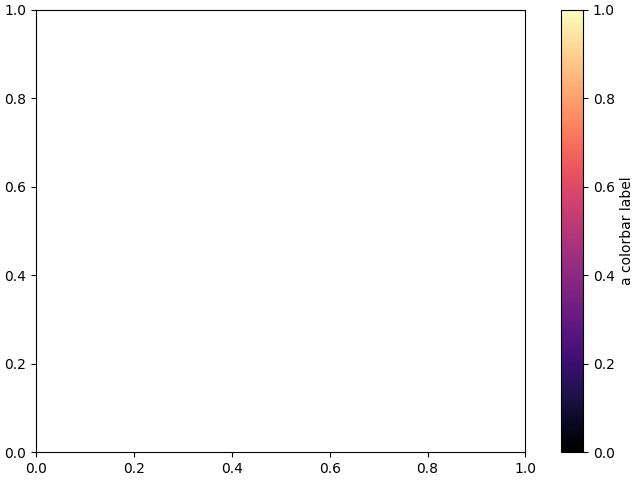
附加在現有軸旁邊的顏色條#
本教學中的所有範例(除了這一個)都顯示在其自身圖表上的獨立顏色條,但可以透過將 ax=ax 傳遞給 colorbar() 呼叫(表示「在 *ax* 旁邊繪製顏色條」)而不是 cax=ax(表示「在 *ax* 上繪製顏色條」),來在現有軸 *ax* 的 *旁邊* 顯示顏色條。
fig, ax = plt.subplots(layout='constrained')

fig.colorbar(mpl.cm.ScalarMappable(norm=mpl.colors.Normalize(0, 1), cmap='magma'),
             ax=ax, orientation='vertical', label='a colorbar label')
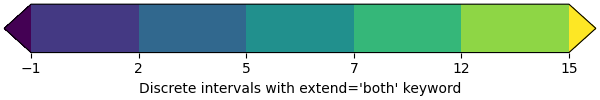
具有連續顏色刻度的離散和擴展顏色條#
以下範例示範如何根據連續的 cmap 製作離散顏色條。我們使用 matplotlib.colors.BoundaryNorm 來描述間隔邊界(必須按遞增順序排列),並進一步將 *extend* 參數傳遞給它,以進一步顯示「超出」和「不足」顏色(用於超出規範範圍的資料)。
fig, ax = plt.subplots(figsize=(6, 1), layout='constrained')

cmap = mpl.cm.viridis
bounds = [-1, 2, 5, 7, 12, 15]
norm = mpl.colors.BoundaryNorm(bounds, cmap.N, extend='both')

fig.colorbar(mpl.cm.ScalarMappable(norm=norm, cmap=cmap),
             cax=ax, orientation='horizontal',
             label="Discrete intervals with extend='both' keyword")
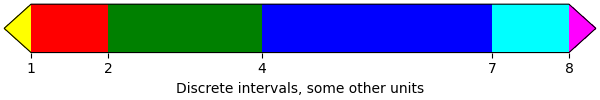
具有任意顏色的顏色條#
以下範例仍然使用 BoundaryNorm 來描述離散的間隔邊界,但現在使用 matplotlib.colors.ListedColormap 將每個間隔與任意顏色關聯(必須有與顏色一樣多的間隔)。使用 Colormap.with_extremes 在色階圖上設定「超出」和「不足」顏色。
我們也將額外參數傳遞給 colorbar
為了在顏色條上顯示超出範圍的值,我們在 colorbar() 呼叫中使用 *extend* 參數。(這相當於在
BoundaryNorm建構函式中傳遞 *extend* 參數,如上一個範例中所述。)為了使每個顏色條區段的長度與其對應的間隔成正比,我們在 colorbar() 呼叫中使用 *spacing* 參數。
fig, ax = plt.subplots(figsize=(6, 1), layout='constrained')

cmap = (mpl.colors.ListedColormap(['red', 'green', 'blue', 'cyan'])
        .with_extremes(under='yellow', over='magenta'))
bounds = [1, 2, 4, 7, 8]
norm = mpl.colors.BoundaryNorm(bounds, cmap.N)

fig.colorbar(
    mpl.cm.ScalarMappable(cmap=cmap, norm=norm),
    cax=ax, orientation='horizontal',
    extend='both',
    spacing='proportional',
    label='Discrete intervals, some other units',
)
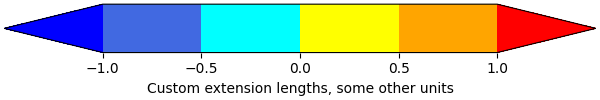
具有自訂擴展長度的顏色條#
我們可以自訂具有離散間隔的顏色條上的長度顏色條擴展。為了使每個擴展的長度與內部顏色的長度相同,請使用 extendfrac='auto'。
fig, ax = plt.subplots(figsize=(6, 1), layout='constrained')

cmap = (mpl.colors.ListedColormap(['royalblue', 'cyan', 'yellow', 'orange'])
        .with_extremes(over='red', under='blue'))
bounds = [-1.0, -0.5, 0.0, 0.5, 1.0]
norm = mpl.colors.BoundaryNorm(bounds, cmap.N)

fig.colorbar(
    mpl.cm.ScalarMappable(cmap=cmap, norm=norm),
    cax=ax, orientation='horizontal',
    extend='both', extendfrac='auto',
    spacing='uniform',
    label='Custom extension lengths, some other units',
)

plt.show()
腳本總執行時間: (0 分鐘 1.127 秒)