注意
跳至結尾以下載完整的範例程式碼。
軸刻度#
每個軸上的 x 和 y 軸都有預設的刻度「定位器」和「格式器」,它們取決於所使用的刻度 (請參閱軸刻度)。可以使用高階方法(例如set_xticks)或直接在軸上設定定位器和格式器來自訂刻度和刻度標籤。
手動位置和格式#
自訂刻度位置和格式的最簡單方法是使用set_xticks 和 set_yticks。這些可以用於主刻度或次刻度。
import numpy as np
import matplotlib.pyplot as plt

import matplotlib.ticker as ticker


fig, axs = plt.subplots(2, 1, figsize=(5.4, 5.4), layout='constrained')
x = np.arange(100)
for nn, ax in enumerate(axs):
    ax.plot(x, x)
    if nn == 1:
        ax.set_title('Manual ticks')
        ax.set_yticks(np.arange(0, 100.1, 100/3))
        xticks = np.arange(0.50, 101, 20)
        xlabels = [f'\\${x:1.2f}' for x in xticks]
        ax.set_xticks(xticks, labels=xlabels)
    else:
        ax.set_title('Automatic ticks')
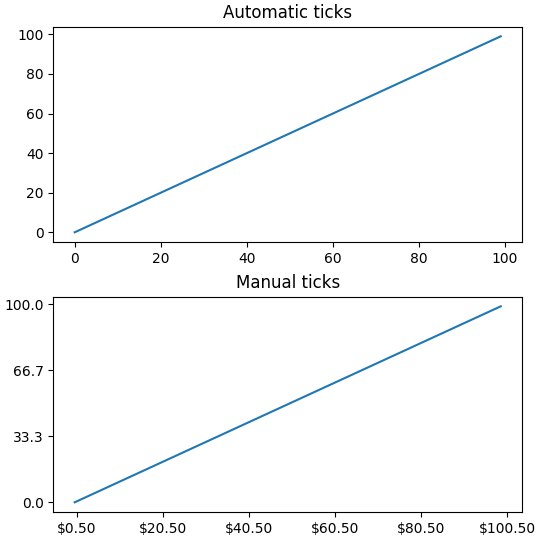
請注意,labels 引數的長度必須與用於指定刻度的陣列長度相同。
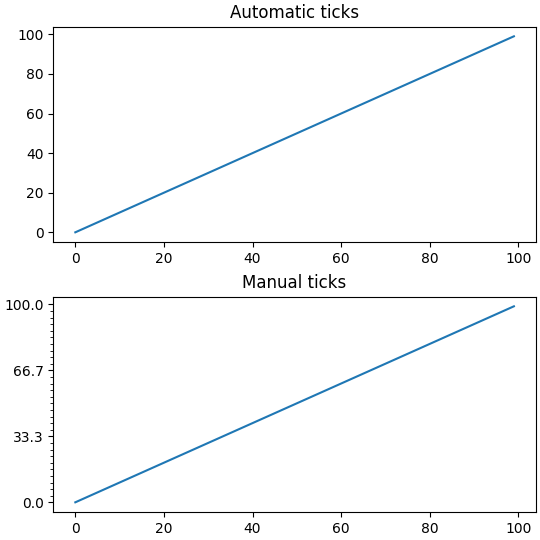
預設情況下,set_xticks 和 set_yticks 會作用於軸的主刻度,但可以新增次刻度
fig, axs = plt.subplots(2, 1, figsize=(5.4, 5.4), layout='constrained')
x = np.arange(100)
for nn, ax in enumerate(axs):
    ax.plot(x, x)
    if nn == 1:
        ax.set_title('Manual ticks')
        ax.set_yticks(np.arange(0, 100.1, 100/3))
        ax.set_yticks(np.arange(0, 100.1, 100/30), minor=True)
    else:
        ax.set_title('Automatic ticks')
定位器和格式器#
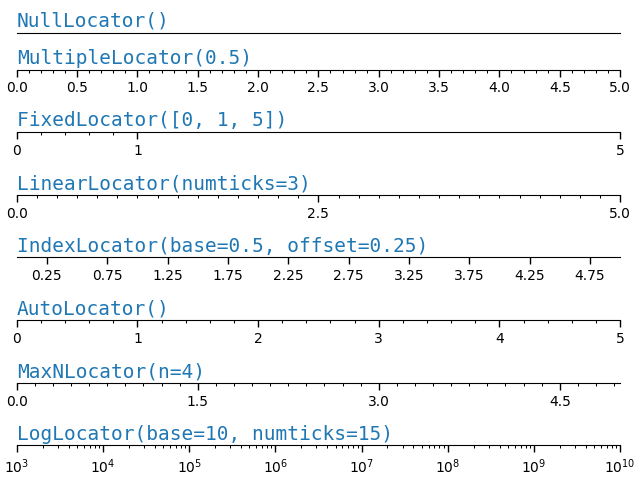
如上所述手動設定刻度對於特定的最終繪圖效果很好,但當使用者與軸互動時,它不會自動調整。在較低的層級,Matplotlib 具有 定位器,它們旨在根據軸的目前檢視限制自動選擇刻度,以及 格式器,它們旨在自動格式化刻度標籤。
Matplotlib 提供的完整定位器列表位於刻度定位,而格式器列表位於刻度格式化。
def setup(ax, title):
    """Set up common parameters for the Axes in the example."""
    # only show the bottom spine
    ax.yaxis.set_major_locator(ticker.NullLocator())
    ax.spines[['left', 'right', 'top']].set_visible(False)

    ax.xaxis.set_ticks_position('bottom')
    ax.tick_params(which='major', width=1.00, length=5)
    ax.tick_params(which='minor', width=0.75, length=2.5)
    ax.set_xlim(0, 5)
    ax.set_ylim(0, 1)
    ax.text(0.0, 0.2, title, transform=ax.transAxes,
            fontsize=14, fontname='Monospace', color='tab:blue')


fig, axs = plt.subplots(8, 1, layout='constrained')

# Null Locator
setup(axs[0], title="NullLocator()")
axs[0].xaxis.set_major_locator(ticker.NullLocator())
axs[0].xaxis.set_minor_locator(ticker.NullLocator())

# Multiple Locator
setup(axs[1], title="MultipleLocator(0.5)")
axs[1].xaxis.set_major_locator(ticker.MultipleLocator(0.5))
axs[1].xaxis.set_minor_locator(ticker.MultipleLocator(0.1))

# Fixed Locator
setup(axs[2], title="FixedLocator([0, 1, 5])")
axs[2].xaxis.set_major_locator(ticker.FixedLocator([0, 1, 5]))
axs[2].xaxis.set_minor_locator(ticker.FixedLocator(np.linspace(0.2, 0.8, 4)))

# Linear Locator
setup(axs[3], title="LinearLocator(numticks=3)")
axs[3].xaxis.set_major_locator(ticker.LinearLocator(3))
axs[3].xaxis.set_minor_locator(ticker.LinearLocator(31))

# Index Locator
setup(axs[4], title="IndexLocator(base=0.5, offset=0.25)")
axs[4].plot(range(0, 5), [0]*5, color='white')
axs[4].xaxis.set_major_locator(ticker.IndexLocator(base=0.5, offset=0.25))

# Auto Locator
setup(axs[5], title="AutoLocator()")
axs[5].xaxis.set_major_locator(ticker.AutoLocator())
axs[5].xaxis.set_minor_locator(ticker.AutoMinorLocator())

# MaxN Locator
setup(axs[6], title="MaxNLocator(n=4)")
axs[6].xaxis.set_major_locator(ticker.MaxNLocator(4))
axs[6].xaxis.set_minor_locator(ticker.MaxNLocator(40))

# Log Locator
setup(axs[7], title="LogLocator(base=10, numticks=15)")
axs[7].set_xlim(10**3, 10**10)
axs[7].set_xscale('log')
axs[7].xaxis.set_major_locator(ticker.LogLocator(base=10, numticks=15))
plt.show()
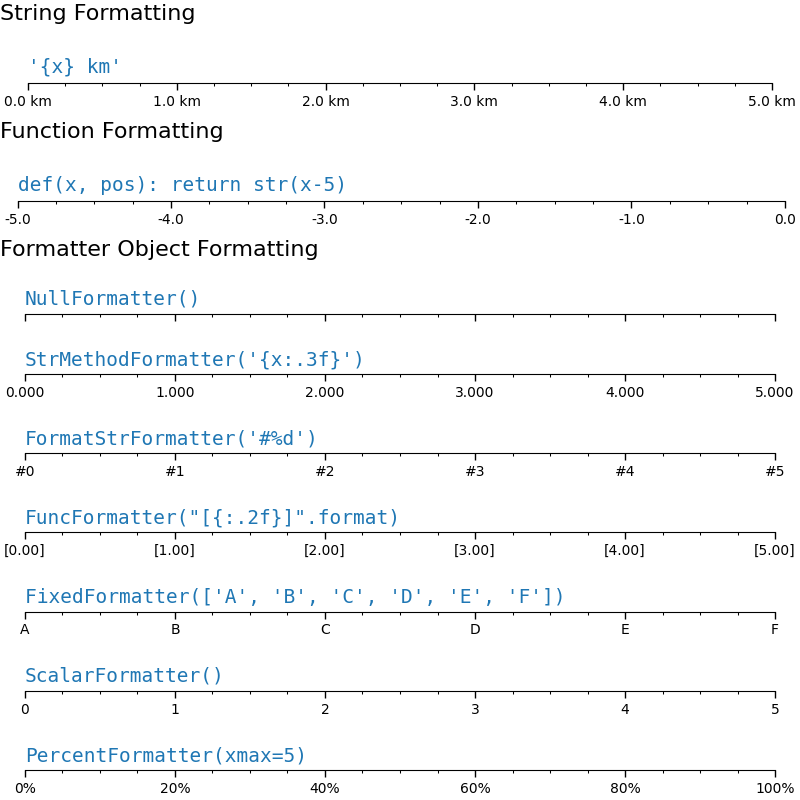
同樣地,我們可以為每個軸上的主刻度和次刻度指定「格式器」。
刻度格式是透過函數set_major_formatter 或 set_minor_formatter 來設定。它接受
格式字串,它會隱式建立
StrMethodFormatter。函數,它會隱式建立
FuncFormatter。Formatter子類別的執行個體。最常見的是NullFormatter:刻度上沒有標籤。StrMethodFormatter:使用字串str.format方法。FormatStrFormatter:使用 % 樣式格式。FuncFormatter:透過函數定義標籤。FixedFormatter:明確設定標籤字串。ScalarFormatter:純量預設格式器:自動選擇格式字串。PercentFormatter:將標籤格式化為百分比。
請參閱刻度格式化以取得完整列表。
def setup(ax, title):
    """Set up common parameters for the Axes in the example."""
    # only show the bottom spine
    ax.yaxis.set_major_locator(ticker.NullLocator())
    ax.spines[['left', 'right', 'top']].set_visible(False)

    # define tick positions
    ax.xaxis.set_major_locator(ticker.MultipleLocator(1.00))
    ax.xaxis.set_minor_locator(ticker.MultipleLocator(0.25))

    ax.xaxis.set_ticks_position('bottom')
    ax.tick_params(which='major', width=1.00, length=5)
    ax.tick_params(which='minor', width=0.75, length=2.5, labelsize=10)
    ax.set_xlim(0, 5)
    ax.set_ylim(0, 1)
    ax.text(0.0, 0.2, title, transform=ax.transAxes,
            fontsize=14, fontname='Monospace', color='tab:blue')


fig = plt.figure(figsize=(8, 8), layout='constrained')
fig0, fig1, fig2 = fig.subfigures(3, height_ratios=[1.5, 1.5, 7.5])

fig0.suptitle('String Formatting', fontsize=16, x=0, ha='left')
ax0 = fig0.subplots()

setup(ax0, title="'{x} km'")
ax0.xaxis.set_major_formatter('{x} km')

fig1.suptitle('Function Formatting', fontsize=16, x=0, ha='left')
ax1 = fig1.subplots()

setup(ax1, title="def(x, pos): return str(x-5)")
ax1.xaxis.set_major_formatter(lambda x, pos: str(x-5))

fig2.suptitle('Formatter Object Formatting', fontsize=16, x=0, ha='left')
axs2 = fig2.subplots(7, 1)

setup(axs2[0], title="NullFormatter()")
axs2[0].xaxis.set_major_formatter(ticker.NullFormatter())

setup(axs2[1], title="StrMethodFormatter('{x:.3f}')")
axs2[1].xaxis.set_major_formatter(ticker.StrMethodFormatter("{x:.3f}"))

setup(axs2[2], title="FormatStrFormatter('#%d')")
axs2[2].xaxis.set_major_formatter(ticker.FormatStrFormatter("#%d"))


def fmt_two_digits(x, pos):
    return f'[{x:.2f}]'


setup(axs2[3], title='FuncFormatter("[{:.2f}]".format)')
axs2[3].xaxis.set_major_formatter(ticker.FuncFormatter(fmt_two_digits))

setup(axs2[4], title="FixedFormatter(['A', 'B', 'C', 'D', 'E', 'F'])")
# FixedFormatter should only be used together with FixedLocator.
# Otherwise, one cannot be sure where the labels will end up.
positions = [0, 1, 2, 3, 4, 5]
labels = ['A', 'B', 'C', 'D', 'E', 'F']
axs2[4].xaxis.set_major_locator(ticker.FixedLocator(positions))
axs2[4].xaxis.set_major_formatter(ticker.FixedFormatter(labels))

setup(axs2[5], title="ScalarFormatter()")
axs2[5].xaxis.set_major_formatter(ticker.ScalarFormatter(useMathText=True))

setup(axs2[6], title="PercentFormatter(xmax=5)")
axs2[6].xaxis.set_major_formatter(ticker.PercentFormatter(xmax=5))
設定刻度樣式(刻度參數)#
刻度的外觀可以透過找到軸上的個別Tick 來以較低層級控制。不過,通常最簡單的方法是使用tick_params 一次變更所有物件。
tick_params 方法可以變更刻度的屬性
長度
方向(在框架內或外)
色彩
寬度和長度
以及是否在軸的底部、頂部、左側或右側繪製刻度。
它也可以控制刻度標籤
labelsize (字體大小)
labelcolor (標籤色彩)
labelrotation
labelbottom、labeltop、labelleft、labelright
此外,還有一個 pad 關鍵字引數,用於指定刻度標籤與刻度的距離。
最後,可以設定網格線條樣式
grid_color
grid_alpha
grid_linewidth
grid_linestyle
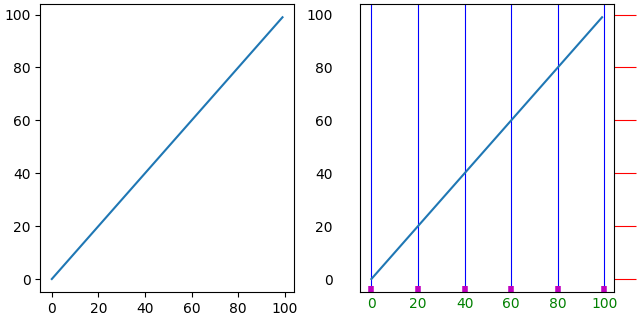
所有這些屬性都可以限制為單一軸,而且可以僅應用於主刻度或次刻度
fig, axs = plt.subplots(1, 2, figsize=(6.4, 3.2), layout='constrained')

for nn, ax in enumerate(axs):
    ax.plot(np.arange(100))
    if nn == 1:
        ax.grid('on')
        ax.tick_params(right=True, left=False, axis='y', color='r', length=16,
                       grid_color='none')
        ax.tick_params(axis='x', color='m', length=4, direction='in', width=4,
                       labelcolor='g', grid_color='b')
指令碼的總執行時間: (0 分鐘 6.593 秒)