mplot3d 工具組#
使用 mplot3d 工具組產生 3D 繪圖。
本教學展示各種 3D 繪圖。點擊圖形以查看每個完整圖庫範例及其產生圖形的程式碼。
3D 軸 (類別為 Axes3D) 是透過將 projection="3d" 關鍵字參數傳遞給 Figure.add_subplot 來建立的
import matplotlib.pyplot as plt
fig = plt.figure()
ax = fig.add_subplot(projection='3d')
如同 2D 子圖一樣,可以在同一圖形上加入多個 3D 子圖。
在 3.2.0 版本變更: 在 Matplotlib 3.2.0 之前,必須明確導入 mpl_toolkits.mplot3d 模組,才能使 '3d' 投影至 Figure.add_subplot。
請參閱 mplot3d 常見問題 以取得關於 mplot3d 工具組的更多資訊。
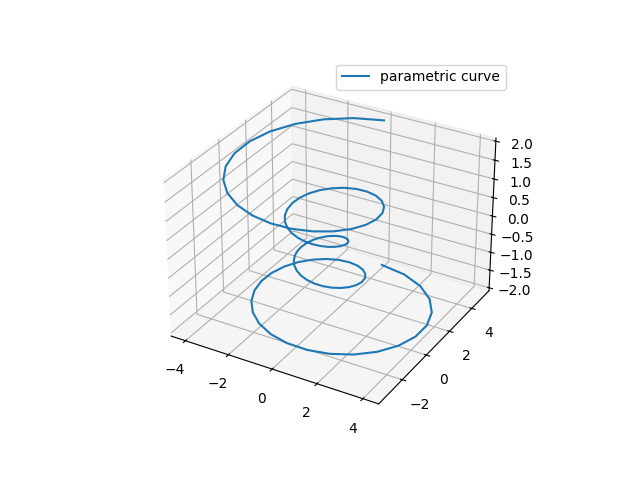
線條圖#
請參閱 Axes3D.plot 以取得 API 文件。
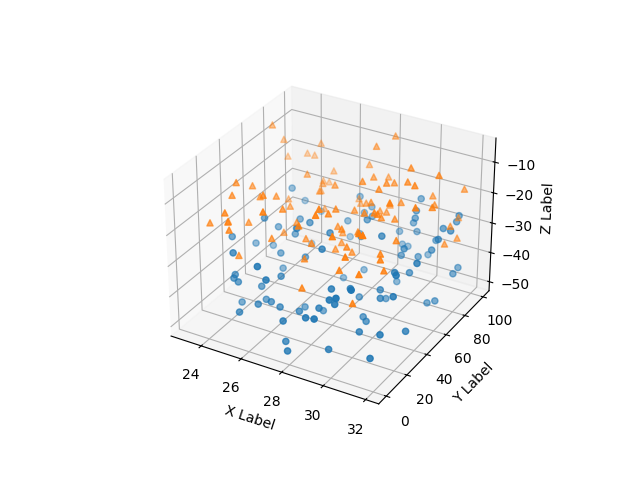
散佈圖#
請參閱 Axes3D.scatter 以取得 API 文件。
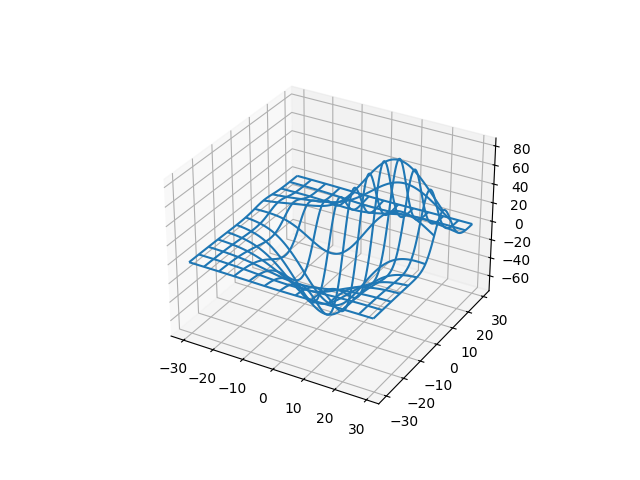
線框圖#
請參閱 Axes3D.plot_wireframe 以取得 API 文件。
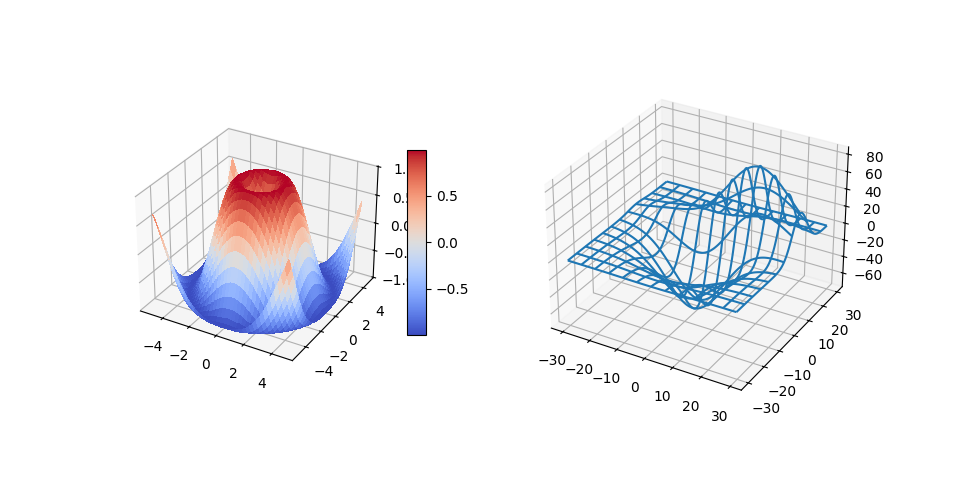
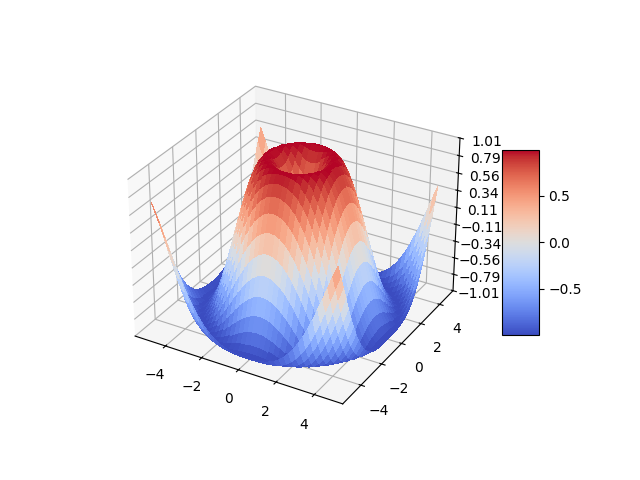
曲面圖#
請參閱 Axes3D.plot_surface 以取得 API 文件。
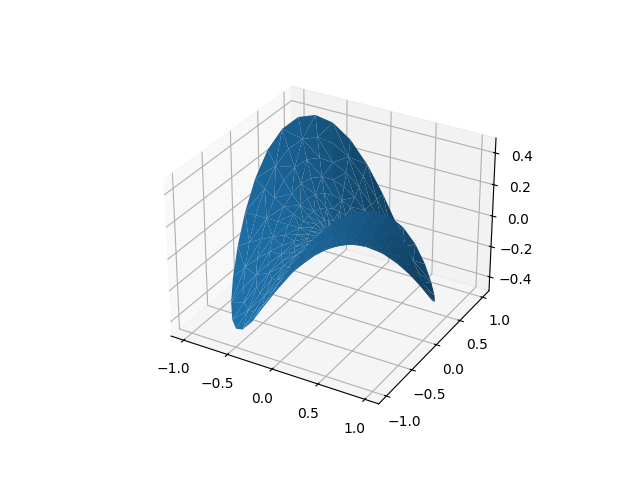
三角曲面圖#
請參閱 Axes3D.plot_trisurf 以取得 API 文件。
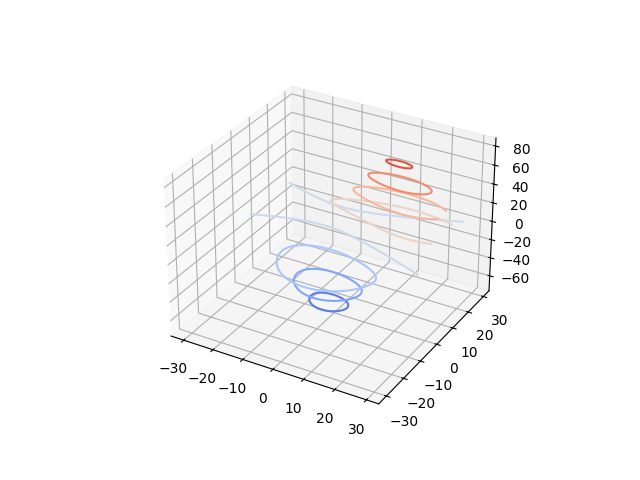
等高線圖#
請參閱 Axes3D.contour 以取得 API 文件。
填滿等高線圖#
請參閱 Axes3D.contourf 以取得 API 文件。
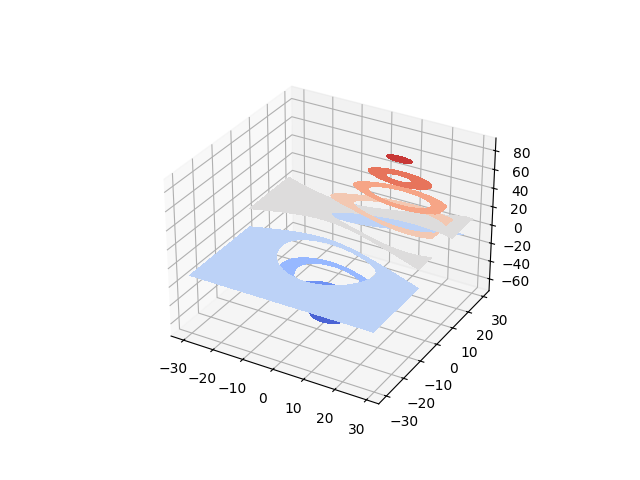
在 1.1.0 版本新增: 第二個 contourf3d 範例中示範的功能是 1.1.0 版本錯誤修復的結果。
3D 線條間填滿#
請參閱 Axes3D.fill_between 以取得 API 文件。
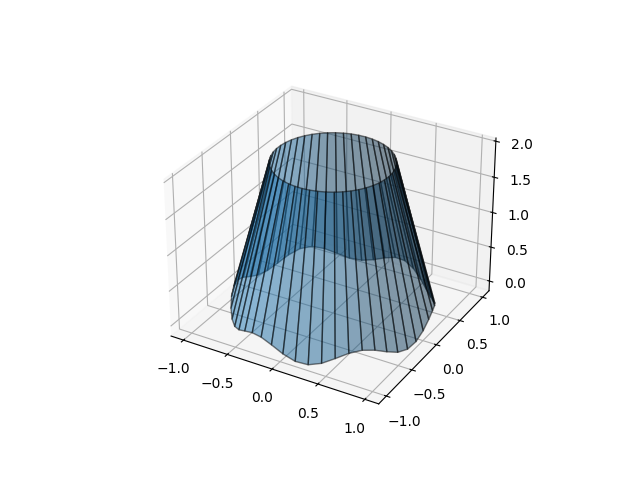
在 3.10 版本新增。
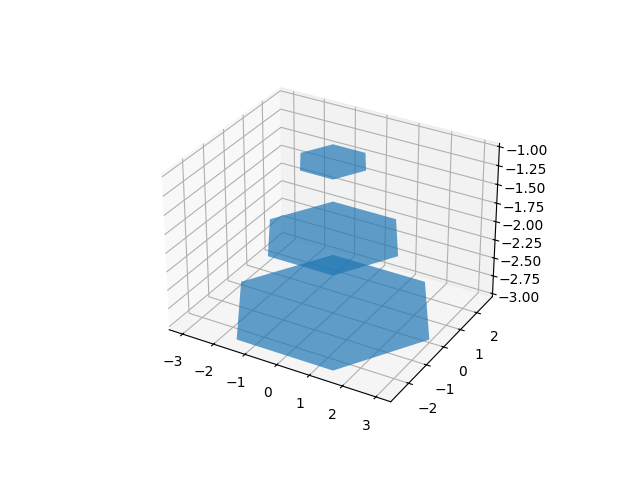
多邊形圖#
請參閱 Axes3D.add_collection3d 以取得 API 文件。
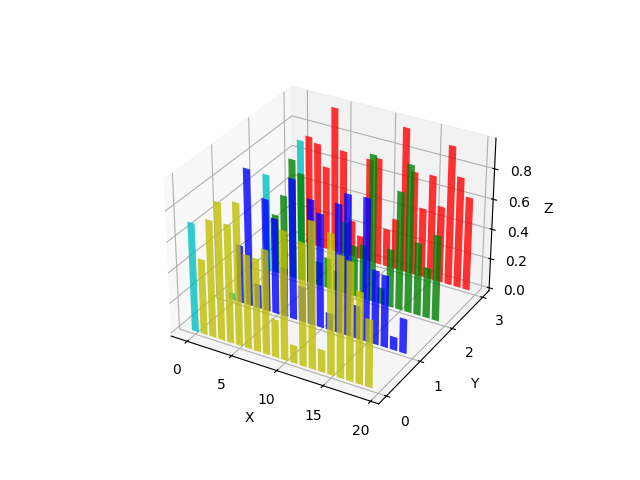
長條圖#
請參閱 Axes3D.bar 以取得 API 文件。
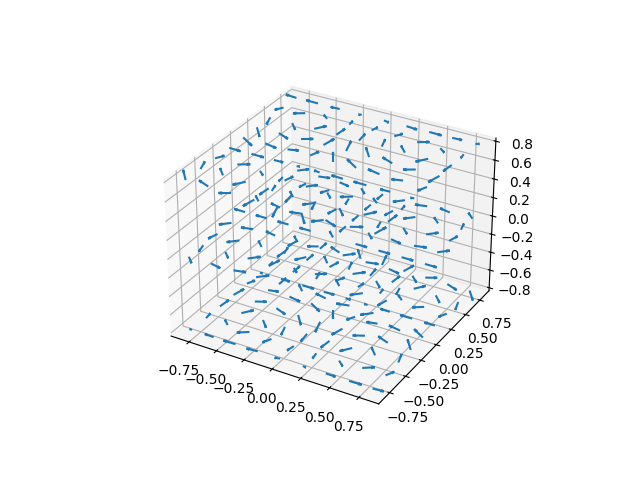
箭袋圖#
請參閱 Axes3D.quiver 以取得 API 文件。
3D 中的 2D 繪圖#
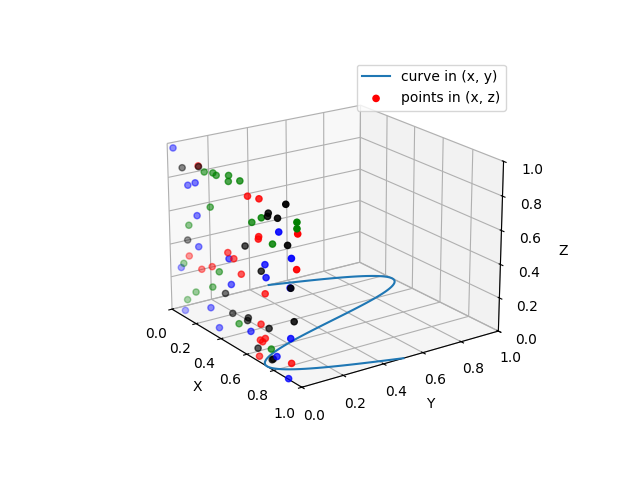
文字#
請參閱 Axes3D.text 以取得 API 文件。
