注意
前往結尾下載完整範例程式碼。
自動縮放軸#
軸的限制可以手動設定(例如,ax.set_xlim(xmin, xmax)),或者 Matplotlib 可以根據軸上已有的資料自動設定。這種自動縮放行為有多種選項,如下所述。
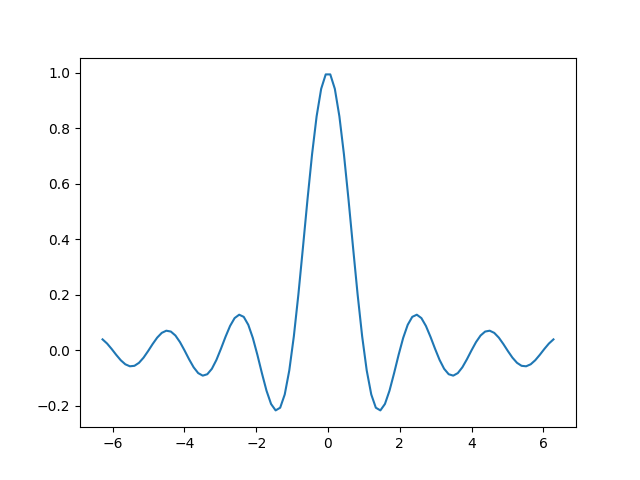
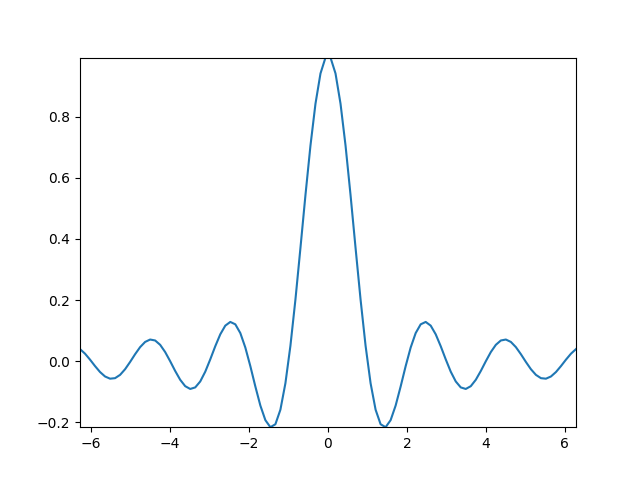
我們將從一個簡單的折線圖開始,顯示自動縮放將軸的限制延伸到資料限制 (-2π, 2π) 之外 5%。
邊距#
資料限制周圍的預設邊距為 5%,這是基於 rcParams["axes.xmargin"] (預設: 0.05)、rcParams["axes.ymargin"] (預設: 0.05) 和 rcParams["axes.zmargin"] (預設: 0.05) 的預設配置設定。
print(ax.margins())
(0.05, 0.05)
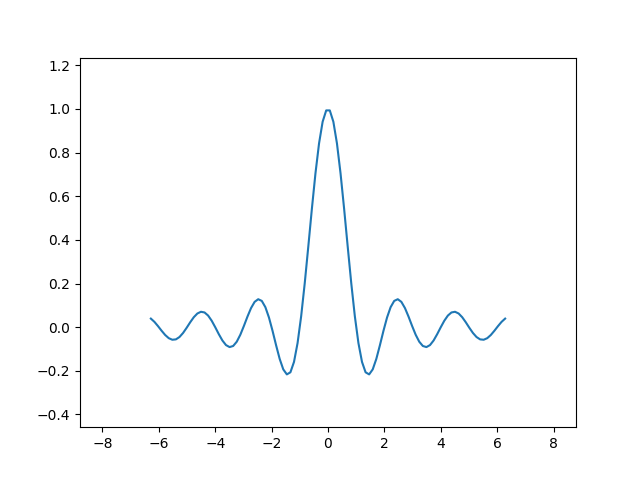
可以使用 margins 來覆寫邊距大小,使其更小或更大。
fig, ax = plt.subplots()
ax.plot(x, y)
ax.margins(0.2, 0.2)
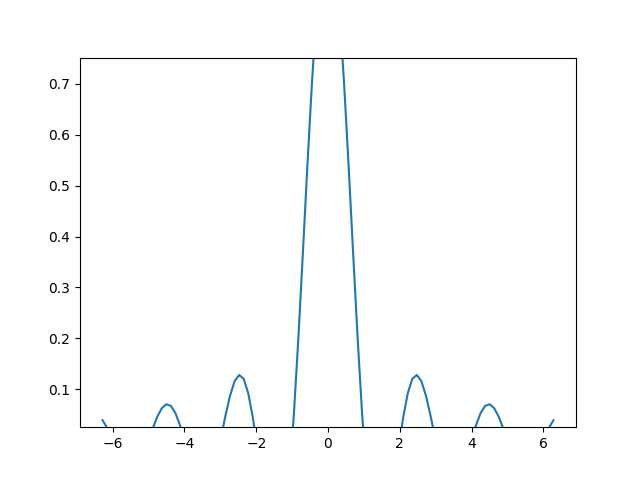
一般來說,邊距的範圍可以是 (-0.5, ∞),其中負邊距會將軸的限制設定為資料範圍的子範圍,也就是說,它們會剪切資料。使用單一數字作為邊距會影響兩個軸,可以使用關鍵字參數 x 或 y 自訂單一邊距,但不能合併位置介面和關鍵字介面。
fig, ax = plt.subplots()
ax.plot(x, y)
ax.margins(y=-0.2)
黏性邊緣#
有一些繪圖元素(Artist),通常會不帶邊距使用。例如,偽色影像(例如,使用 Axes.imshow 建立的)不會在邊距計算中被考慮。
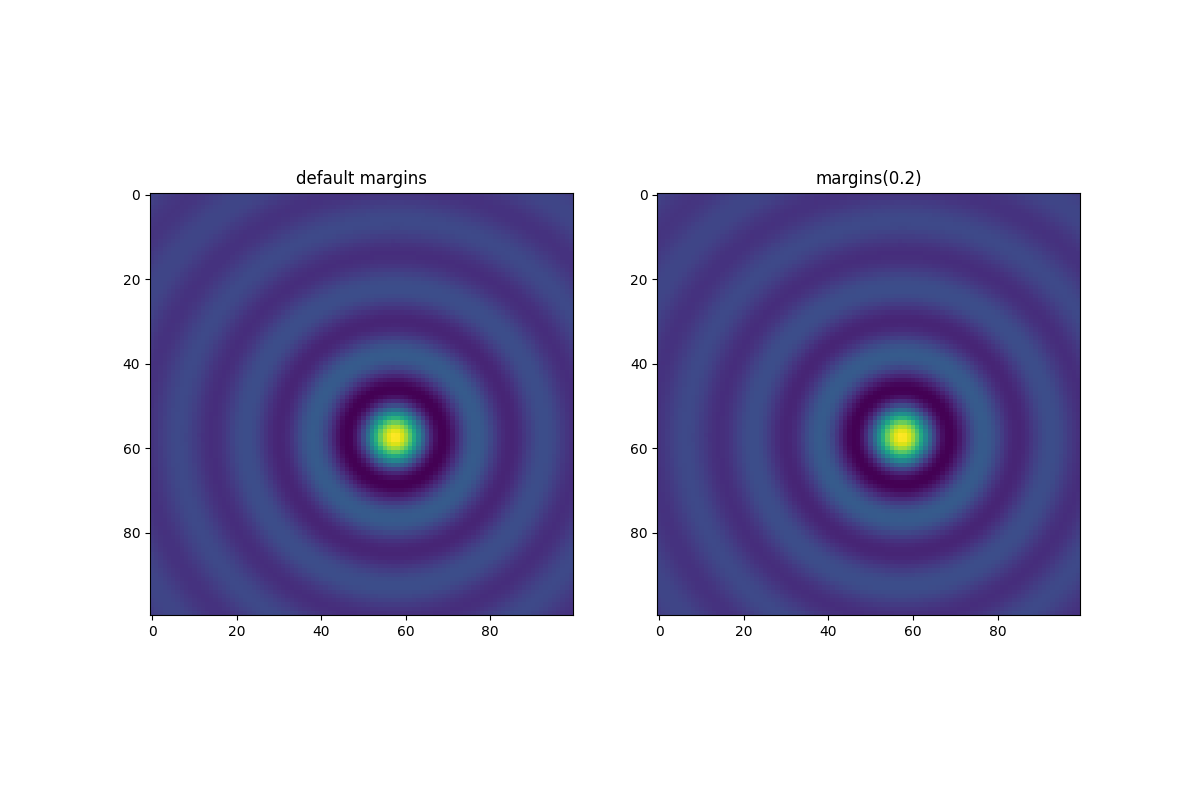
這種邊距覆寫是由「黏性邊緣」決定的,這是 Artist 類別的屬性,可以抑制將邊距新增到軸的限制。可以透過變更 use_sticky_edges 來停用軸上的黏性邊緣效果。藝術家有一個屬性 Artist.sticky_edges,並且可以透過寫入 Artist.sticky_edges.x 或 Artist.sticky_edges.y 來變更黏性邊緣的值。
以下範例顯示覆寫是如何運作以及何時需要覆寫。
fig, ax = plt.subplots(ncols=3, figsize=(16, 10))
ax[0].imshow(zz)
ax[0].margins(0.2)
ax[0].set_title("default use_sticky_edges\nmargins(0.2)")
ax[1].imshow(zz)
ax[1].margins(0.2)
ax[1].use_sticky_edges = False
ax[1].set_title("use_sticky_edges=False\nmargins(0.2)")
ax[2].imshow(zz)
ax[2].margins(-0.2)
ax[2].set_title("default use_sticky_edges\nmargins(-0.2)")
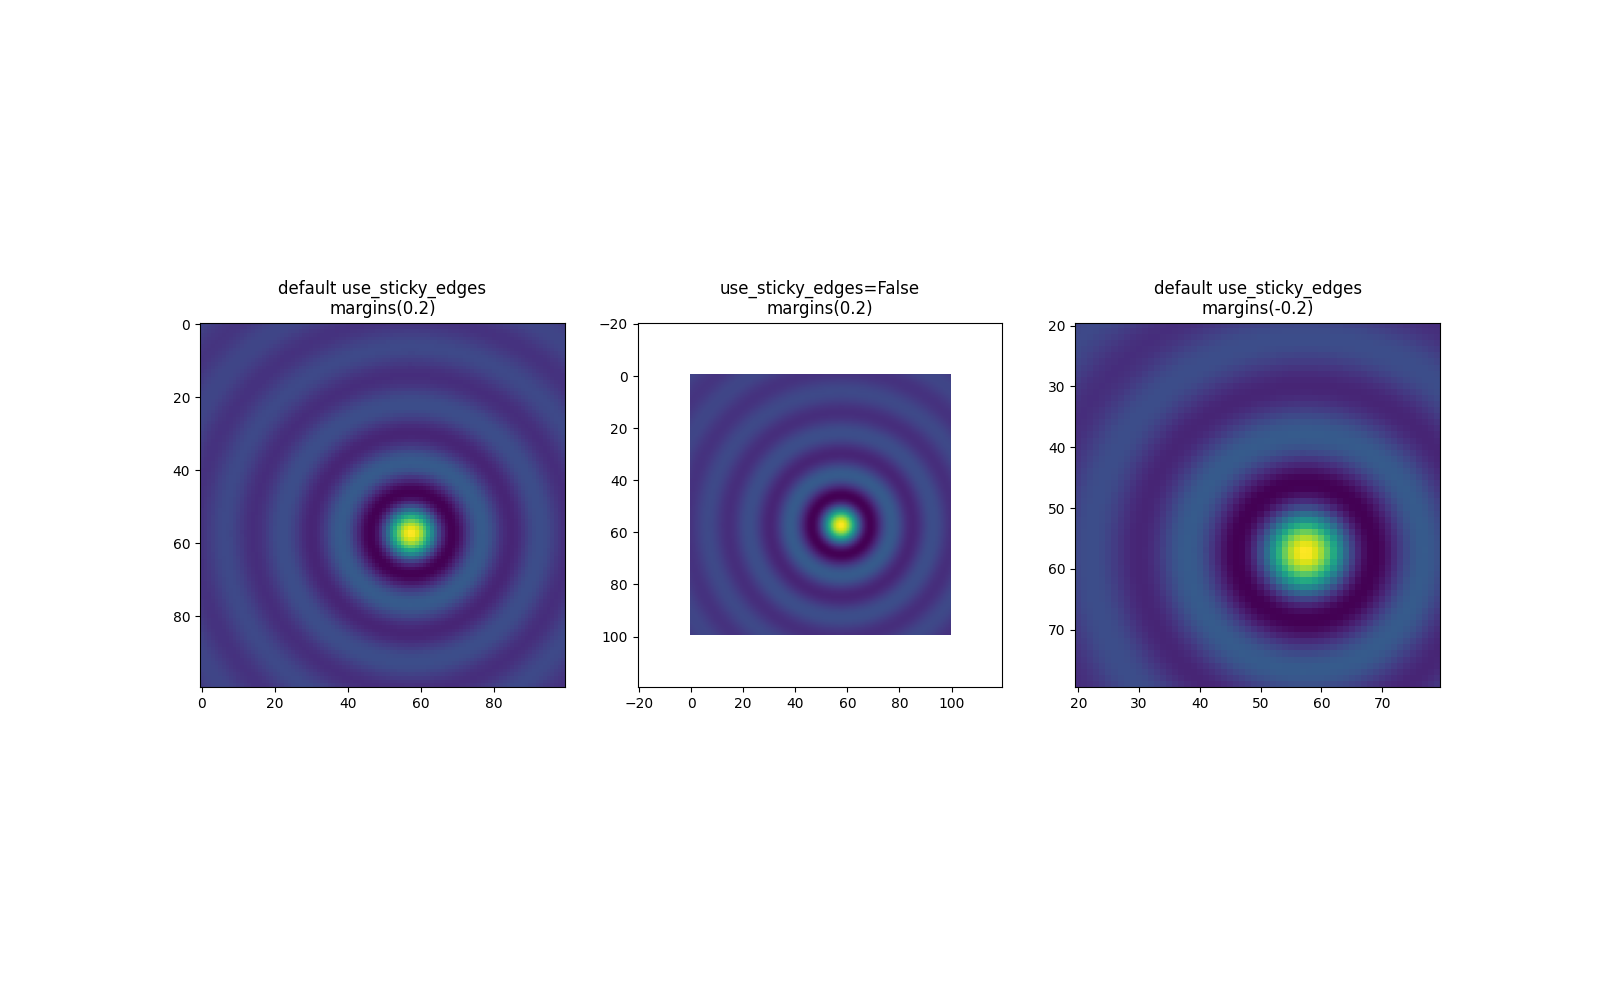
我們可以看到將 use_sticky_edges 設定為 False 會以要求的邊距渲染影像。
雖然黏性邊緣不會透過額外的邊距增加軸的限制,但仍會考慮負邊距。這可以在第三張影像的縮小限制中看到。
控制自動縮放#
預設情況下,每次您在圖中新增新的曲線時,都會重新計算限制
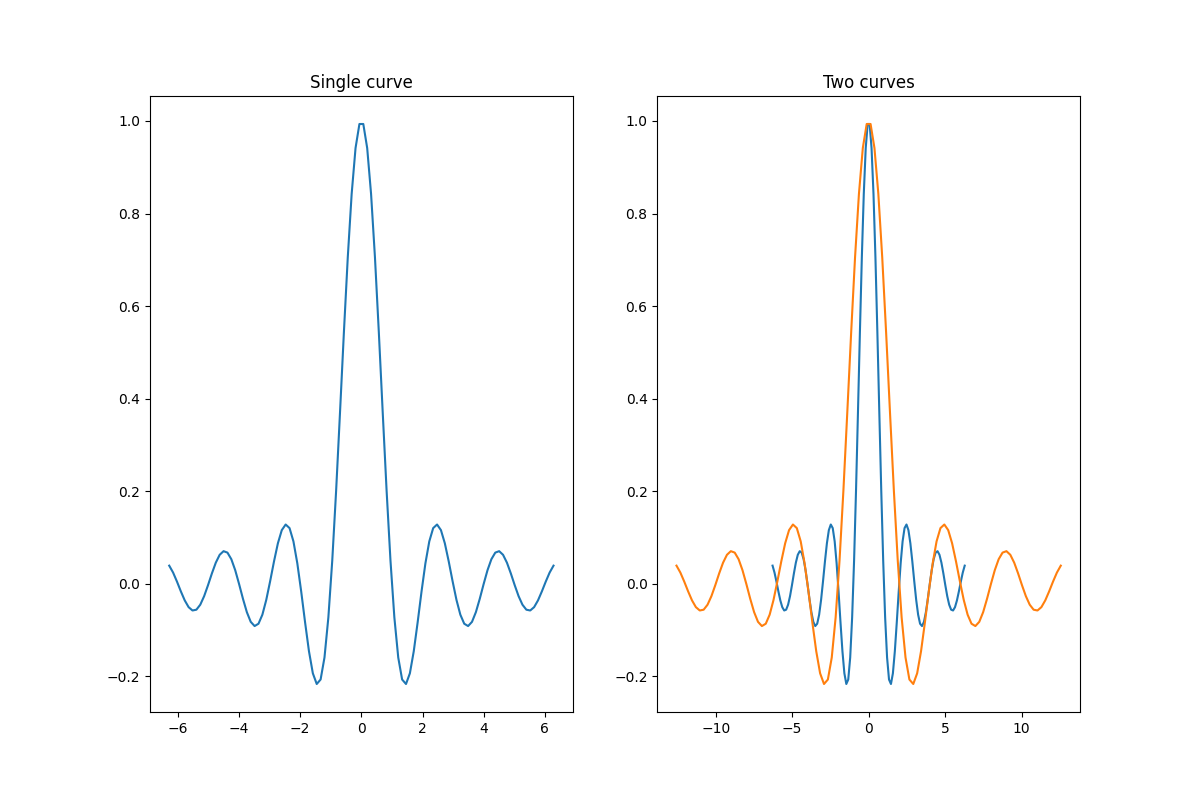
但是,在某些情況下,您不希望自動調整視窗以顯示新資料。
停用自動縮放的一種方法是手動設定軸的限制。假設我們想更詳細地查看部分資料。即使我們在資料中新增更多曲線,設定 xlim 也會持續存在。要重新計算新限制,請呼叫 Axes.autoscale 將手動切換此功能。
fig, ax = plt.subplots(ncols=2, figsize=(12, 8))
ax[0].plot(x, y)
ax[0].set_xlim(left=-1, right=1)
ax[0].plot(x + np.pi * 0.5, y)
ax[0].set_title("set_xlim(left=-1, right=1)\n")
ax[1].plot(x, y)
ax[1].set_xlim(left=-1, right=1)
ax[1].plot(x + np.pi * 0.5, y)
ax[1].autoscale()
ax[1].set_title("set_xlim(left=-1, right=1)\nautoscale()")
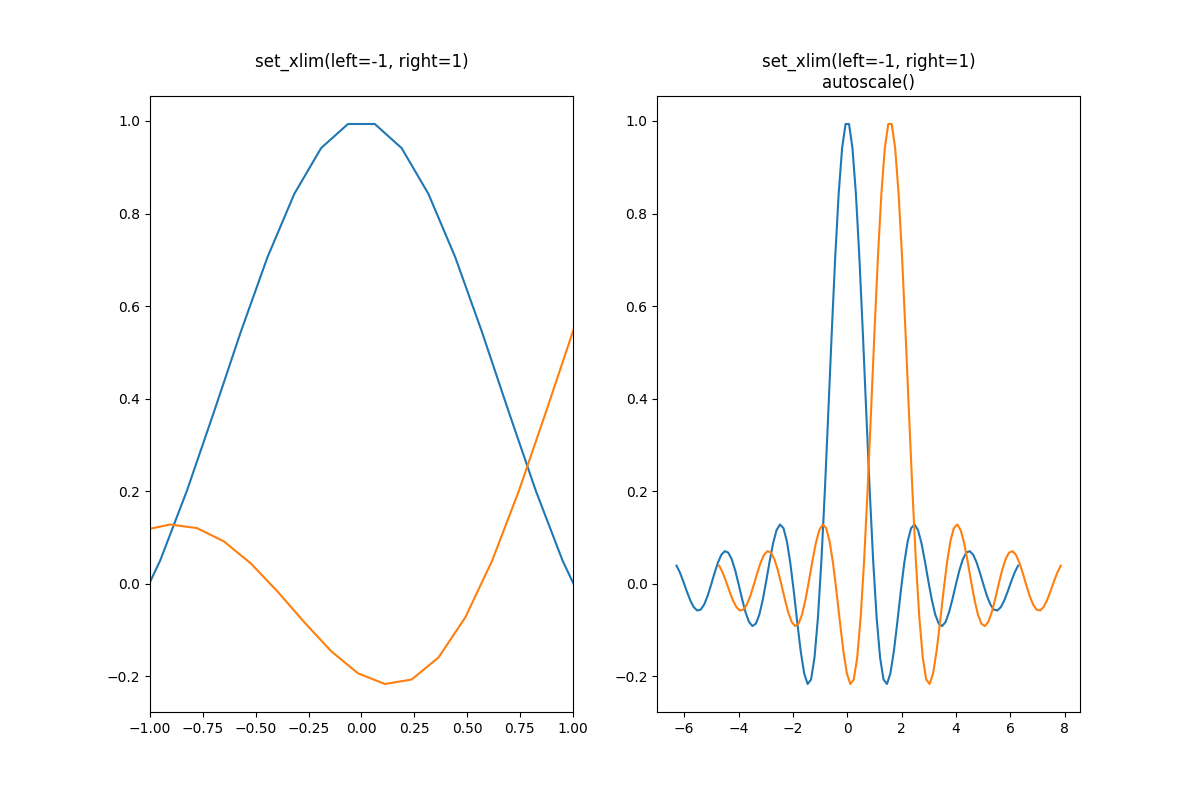
我們可以使用 Axes.get_autoscale_on() 來檢查第一個繪圖是否已停用自動縮放,以及第二個繪圖是否已再次啟用自動縮放。
False
True
自動縮放函式的引數讓我們可以精確控制自動縮放的過程。引數 enable 和 axis 的組合會為選定的軸(或兩個軸)設定自動縮放功能。引數 tight 會將選定軸的邊距設定為零。要保留 enable 或 tight 的設定,您可以將另一個設定為 None,這樣它就不會被修改。但是,將 enable 設定為 None 並且 tight 設定為 True 會影響兩個軸,而不管 axis 引數為何。
fig, ax = plt.subplots()
ax.plot(x, y)
ax.margins(0.2, 0.2)
ax.autoscale(enable=None, axis="x", tight=True)

print(ax.margins())
(0, 0)
使用集合#
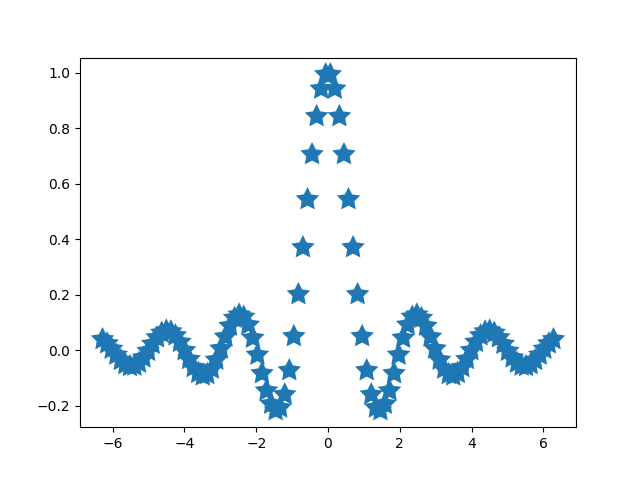
自動縮放適用於新增到軸的所有線條、補丁和影像。它無法與之搭配使用的藝術家之一是 Collection。將集合新增到軸後,必須手動觸發 autoscale_view() 以重新計算軸的限制。
fig, ax = plt.subplots()
collection = mpl.collections.StarPolygonCollection(
    5, rotation=0, sizes=(250,),  # five point star, zero angle, size 250px
    offsets=np.column_stack([x, y]),  # Set the positions
    offset_transform=ax.transData,  # Propagate transformations of the Axes
)
ax.add_collection(collection)
ax.autoscale_view()
腳本的總執行時間:(0 分鐘 8.887 秒)