繪圖類型#
Matplotlib 提供的許多常見繪圖指令概觀。
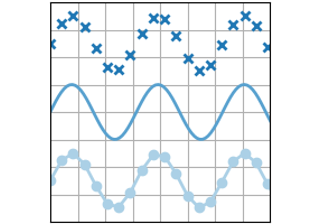
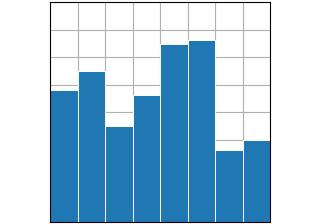
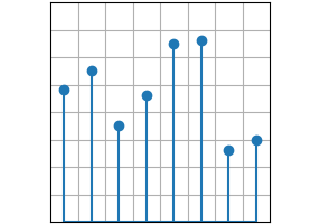
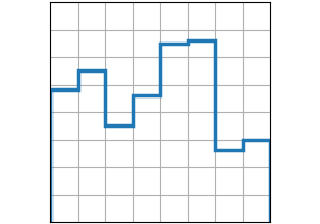
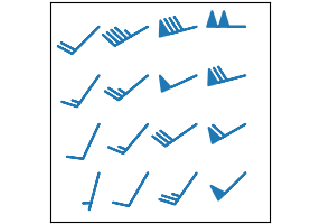
成對資料#
成對\((x, y)\)、表格\((var\_0, \cdots, var\_n)\)和函數\(f(x)=y\)資料的繪圖。
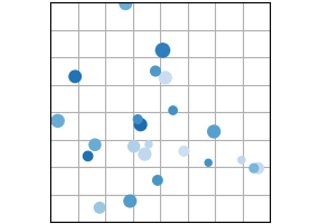
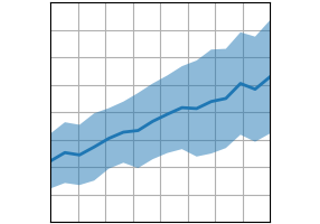
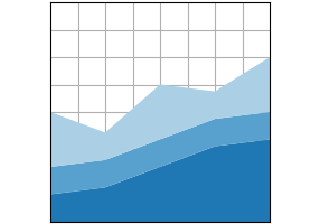
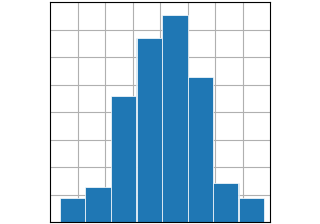
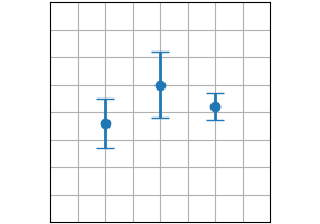
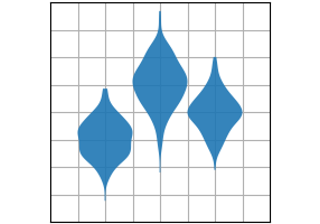
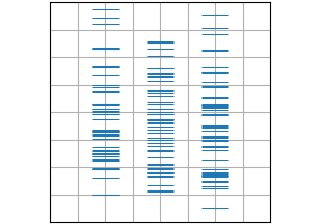
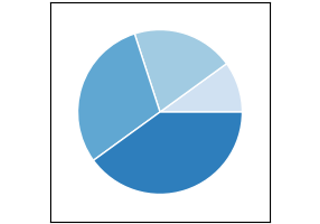
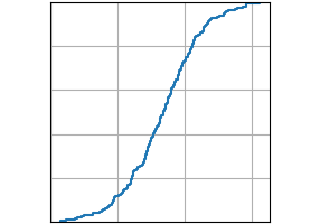
統計分佈#
資料集中至少一個變數分佈的繪圖。 其中一些方法也會計算分佈。

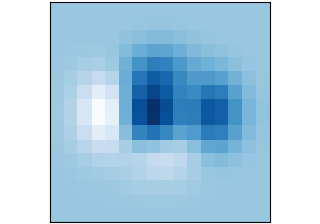
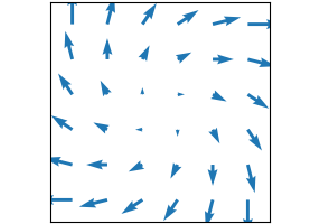
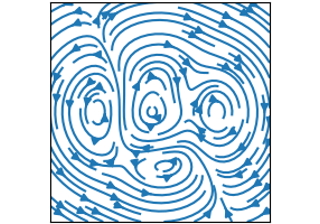
網格資料#
在規則網格上的陣列和影像\(Z_{i, j}\)以及欄位\(U_{i, j}, V_{i, j}\)的繪圖,以及對應的座標網格\(X_{i,j}, Y_{i,j}\)。
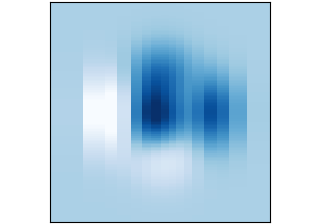


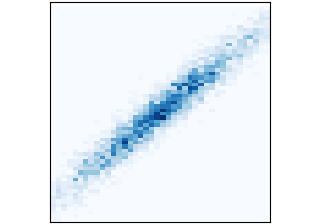
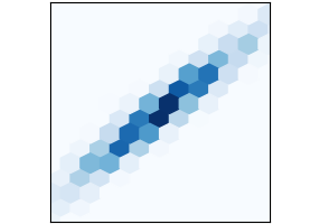
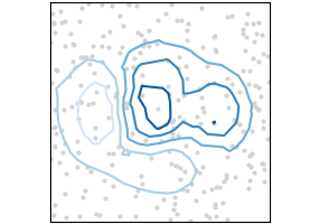
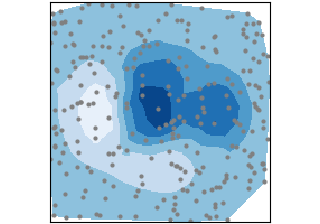
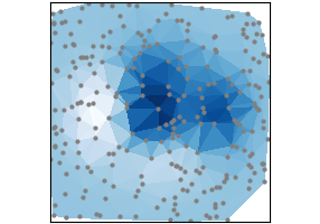
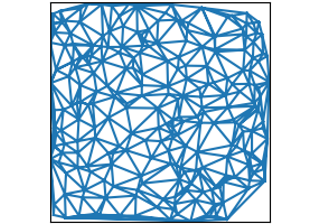
不規則網格資料#
在非結構化網格上的資料\(Z_{x, y}\)、非結構化座標網格\((x, y)\)和 2D 函數\(f(x, y) = z\)的繪圖。
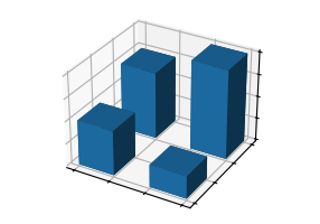
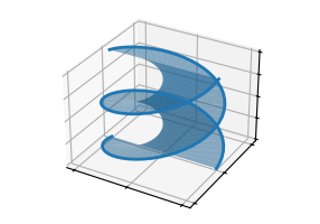
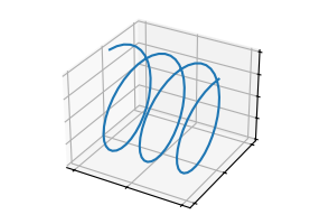
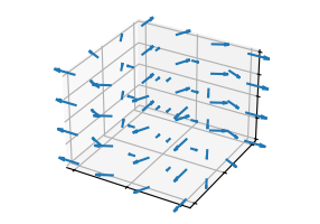
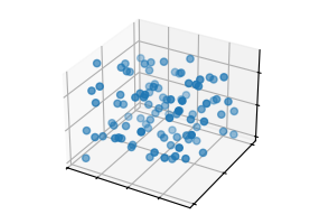
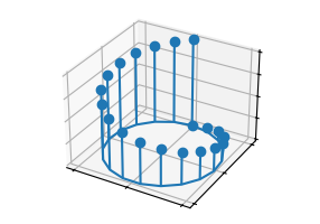
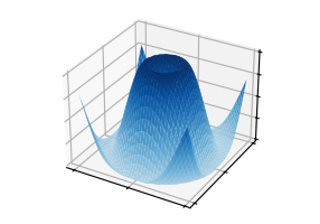
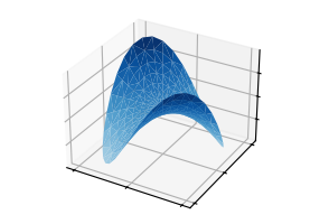
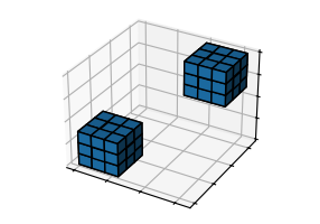
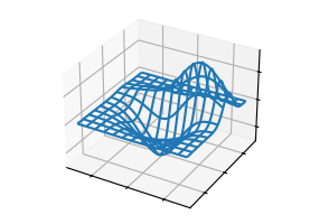
3D 和體積資料#
使用mpl_toolkits.mplot3d函式庫的三維\((x,y,z)\)、曲面\(f(x,y)=z\)和體積\(V_{x, y, z}\)資料的繪圖。