注意
前往末尾以下載完整的範例程式碼。
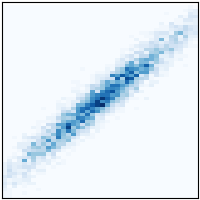
hist2d(x, y)#
繪製 2D 直方圖。
請參閱 hist2d。
import matplotlib.pyplot as plt
import numpy as np

plt.style.use('_mpl-gallery-nogrid')

# make data: correlated + noise
np.random.seed(1)
x = np.random.randn(5000)
y = 1.2 * x + np.random.randn(5000) / 3

# plot:
fig, ax = plt.subplots()

ax.hist2d(x, y, bins=(np.arange(-3, 3, 0.1), np.arange(-3, 3, 0.1)))

ax.set(xlim=(-2, 2), ylim=(-3, 3))

plt.show()