注意
前往結尾以下載完整的範例程式碼。
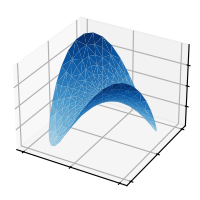
plot_trisurf(x, y, z)#
請參閱 plot_trisurf。
import matplotlib.pyplot as plt
import numpy as np

from matplotlib import cm

plt.style.use('_mpl-gallery')

n_radii = 8
n_angles = 36

# Make radii and angles spaces
radii = np.linspace(0.125, 1.0, n_radii)
angles = np.linspace(0, 2*np.pi, n_angles, endpoint=False)[..., np.newaxis]

# Convert polar (radii, angles) coords to cartesian (x, y) coords.
x = np.append(0, (radii*np.cos(angles)).flatten())
y = np.append(0, (radii*np.sin(angles)).flatten())
z = np.sin(-x*y)

# Plot
fig, ax = plt.subplots(subplot_kw={'projection': '3d'})
ax.plot_trisurf(x, y, z, vmin=z.min() * 2, cmap=cm.Blues)

ax.set(xticklabels=[],
       yticklabels=[],
       zticklabels=[])

plt.show()