注意
跳至結尾以下載完整的範例程式碼。
quiver(X, Y, U, V)#
繪製 2D 箭頭場。
請參閱 quiver。
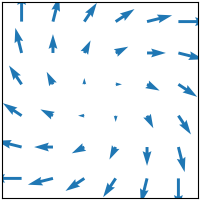
import matplotlib.pyplot as plt
import numpy as np

plt.style.use('_mpl-gallery-nogrid')

# make data
x = np.linspace(-4, 4, 6)
y = np.linspace(-4, 4, 6)
X, Y = np.meshgrid(x, y)
U = X + Y
V = Y - X

# plot
fig, ax = plt.subplots()

ax.quiver(X, Y, U, V, color="C0", angles='xy',
          scale_units='xy', scale=5, width=.015)

ax.set(xlim=(-5, 5), ylim=(-5, 5))

plt.show()