注意
跳至末尾以下載完整範例程式碼。
hist(x)#
計算並繪製直方圖。
請參閱 hist。
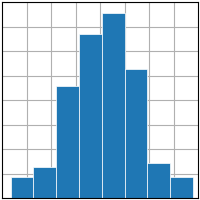
import matplotlib.pyplot as plt
import numpy as np

plt.style.use('_mpl-gallery')

# make data
np.random.seed(1)
x = 4 + np.random.normal(0, 1.5, 200)

# plot:
fig, ax = plt.subplots()

ax.hist(x, bins=8, linewidth=0.5, edgecolor="white")

ax.set(xlim=(0, 8), xticks=np.arange(1, 8),
       ylim=(0, 56), yticks=np.linspace(0, 56, 9))

plt.show()