注意
前往結尾以下載完整範例程式碼。
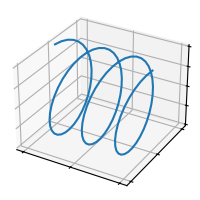
plot(xs, ys, zs)#
請參閱plot。
import matplotlib.pyplot as plt
import numpy as np

plt.style.use('_mpl-gallery')

# Make data
n = 100
xs = np.linspace(0, 1, n)
ys = np.sin(xs * 6 * np.pi)
zs = np.cos(xs * 6 * np.pi)

# Plot
fig, ax = plt.subplots(subplot_kw={"projection": "3d"})
ax.plot(xs, ys, zs)

ax.set(xticklabels=[],
       yticklabels=[],
       zticklabels=[])

plt.show()