注意
跳至結尾下載完整的範例程式碼。
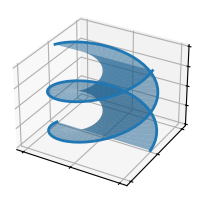
fill_between(x1, y1, z1, x2, y2, z2)#
請參閱 fill_between。
import matplotlib.pyplot as plt
import numpy as np

plt.style.use('_mpl-gallery')

# Make data for a double helix
n = 50
theta = np.linspace(0, 2*np.pi, n)
x1 = np.cos(theta)
y1 = np.sin(theta)
z1 = np.linspace(0, 1, n)
x2 = np.cos(theta + np.pi)
y2 = np.sin(theta + np.pi)
z2 = z1

# Plot
fig, ax = plt.subplots(subplot_kw={"projection": "3d"})
ax.fill_between(x1, y1, z1, x2, y2, z2, alpha=0.5)
ax.plot(x1, y1, z1, linewidth=2, color='C0')
ax.plot(x2, y2, z2, linewidth=2, color='C0')

ax.set(xticklabels=[],
       yticklabels=[],
       zticklabels=[])

plt.show()