注意
前往結尾以下載完整的範例程式碼。
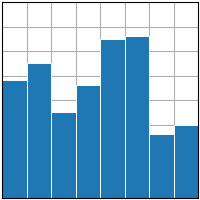
bar(x, height)#
請參閱 bar。
import matplotlib.pyplot as plt
import numpy as np

plt.style.use('_mpl-gallery')

# make data:
x = 0.5 + np.arange(8)
y = [4.8, 5.5, 3.5, 4.6, 6.5, 6.6, 2.6, 3.0]

# plot
fig, ax = plt.subplots()

ax.bar(x, y, width=1, edgecolor="white", linewidth=0.7)

ax.set(xlim=(0, 8), xticks=np.arange(1, 8),
       ylim=(0, 8), yticks=np.arange(1, 8))

plt.show()