Matplotlib 3.7.0 的新功能 (2023 年 2 月 13 日)#
如需上次修訂以來的所有問題和提取請求的列表,請參閱 3.10.0 (2024 年 12 月 13 日) 的 GitHub 統計數據。
繪圖和註解改進#
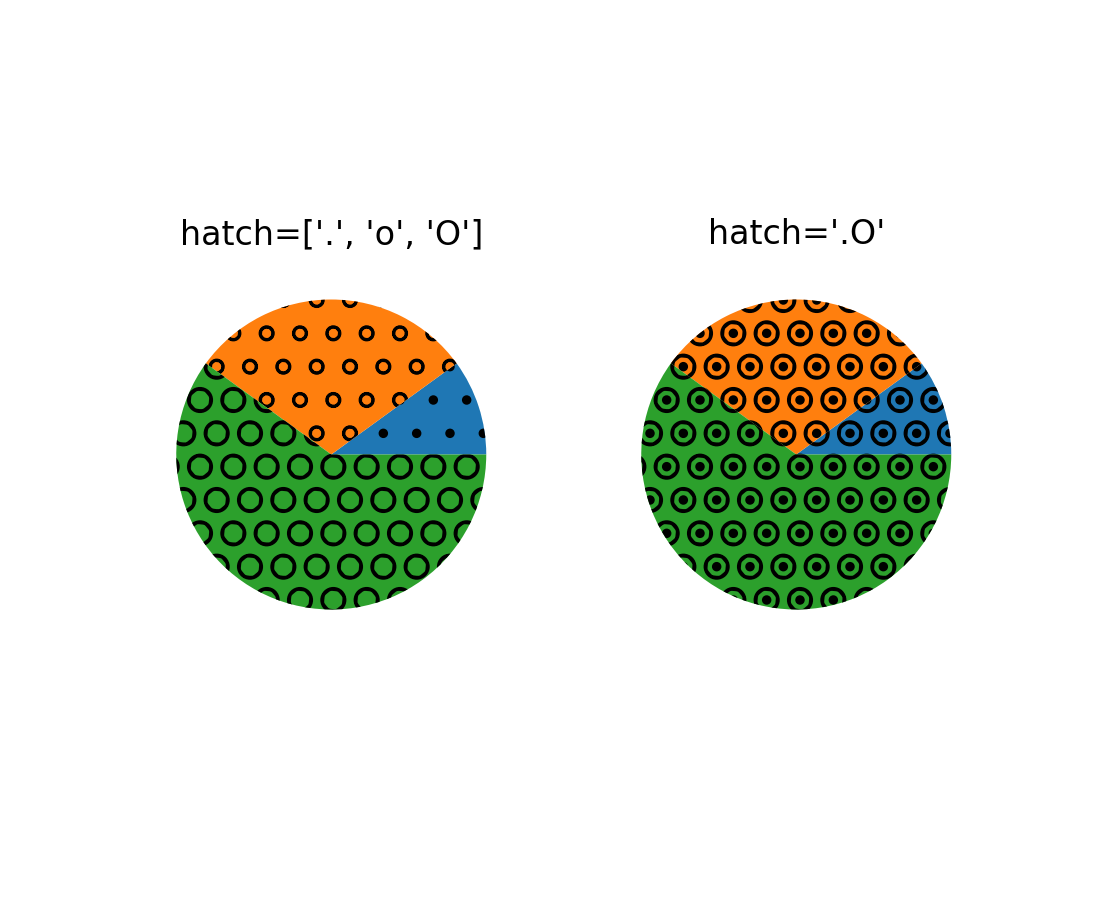
圓餅圖的 hatch 參數#
pie 現在接受 hatch 關鍵字,它將陰影或陰影列表作為輸入
fig, (ax1, ax2) = plt.subplots(ncols=2)
x = [10, 30, 60]

ax1.pie(x, hatch=['.', 'o', 'O'])
ax2.pie(x, hatch='.O')

ax1.set_title("hatch=['.', 'o', 'O']")
ax2.set_title("hatch='.O'")
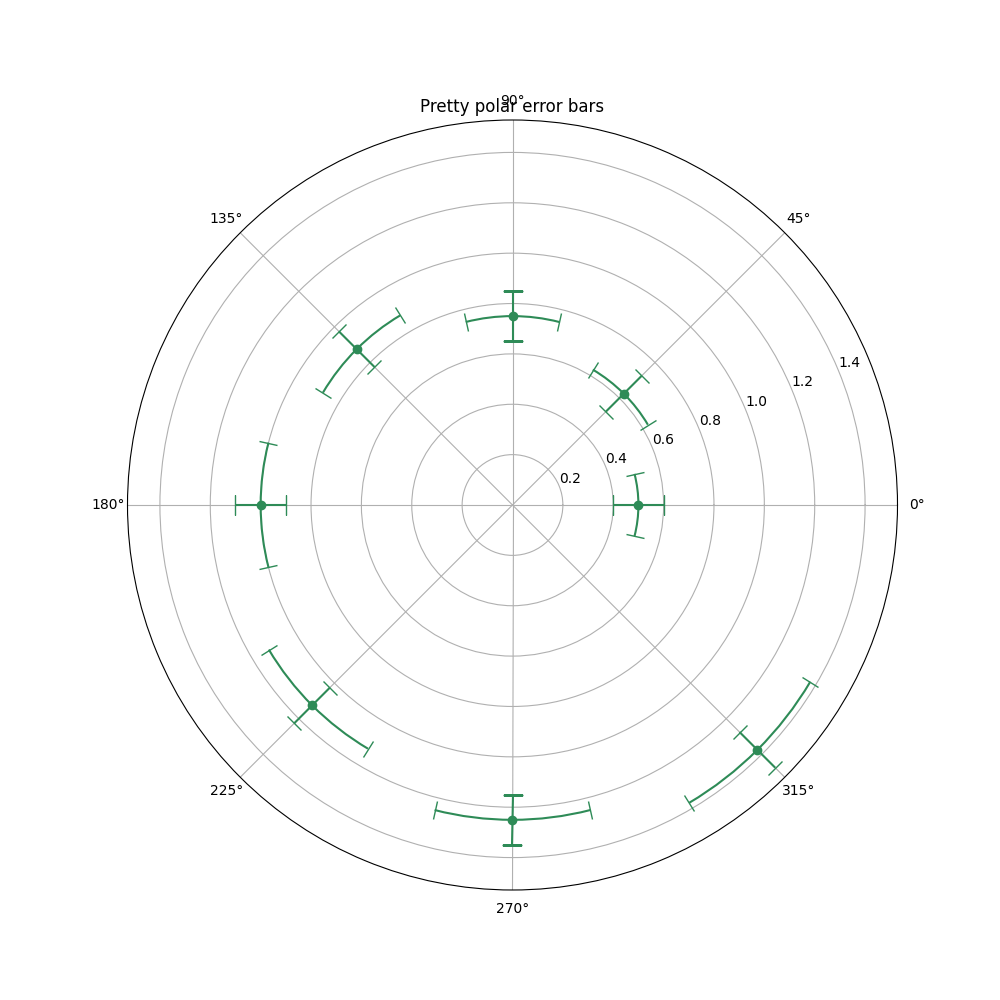
以極座標繪製的極座標圖錯誤#
在極座標圖上繪製誤差線時,現在會根據極座標繪製帽和誤差線。
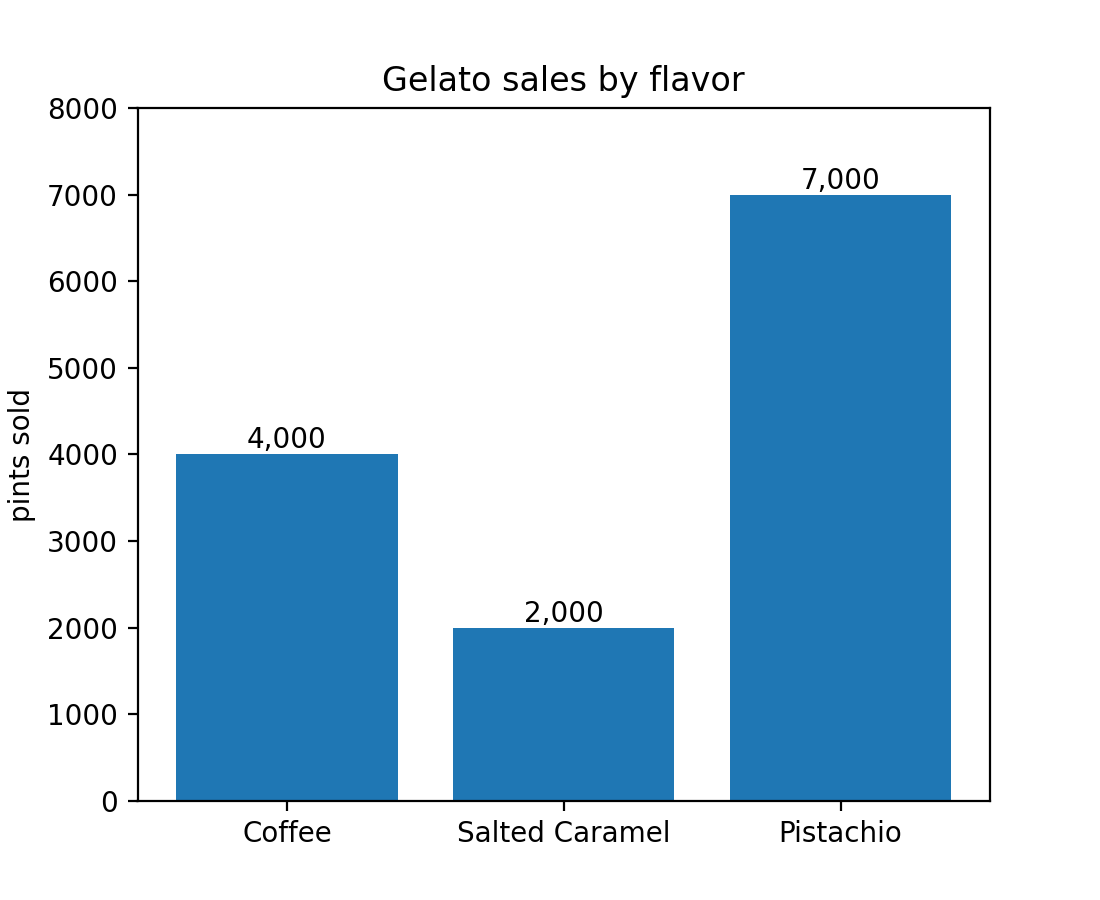
bar_label 中的其他格式字串選項#
bar_label 的 fmt 引數現在接受 {}-樣式的格式字串
import matplotlib.pyplot as plt

fruit_names = ['Coffee', 'Salted Caramel', 'Pistachio']
fruit_counts = [4000, 2000, 7000]

fig, ax = plt.subplots()
bar_container = ax.bar(fruit_names, fruit_counts)
ax.set(ylabel='pints sold', title='Gelato sales by flavor', ylim=(0, 8000))
ax.bar_label(bar_container, fmt='{:,.0f}')
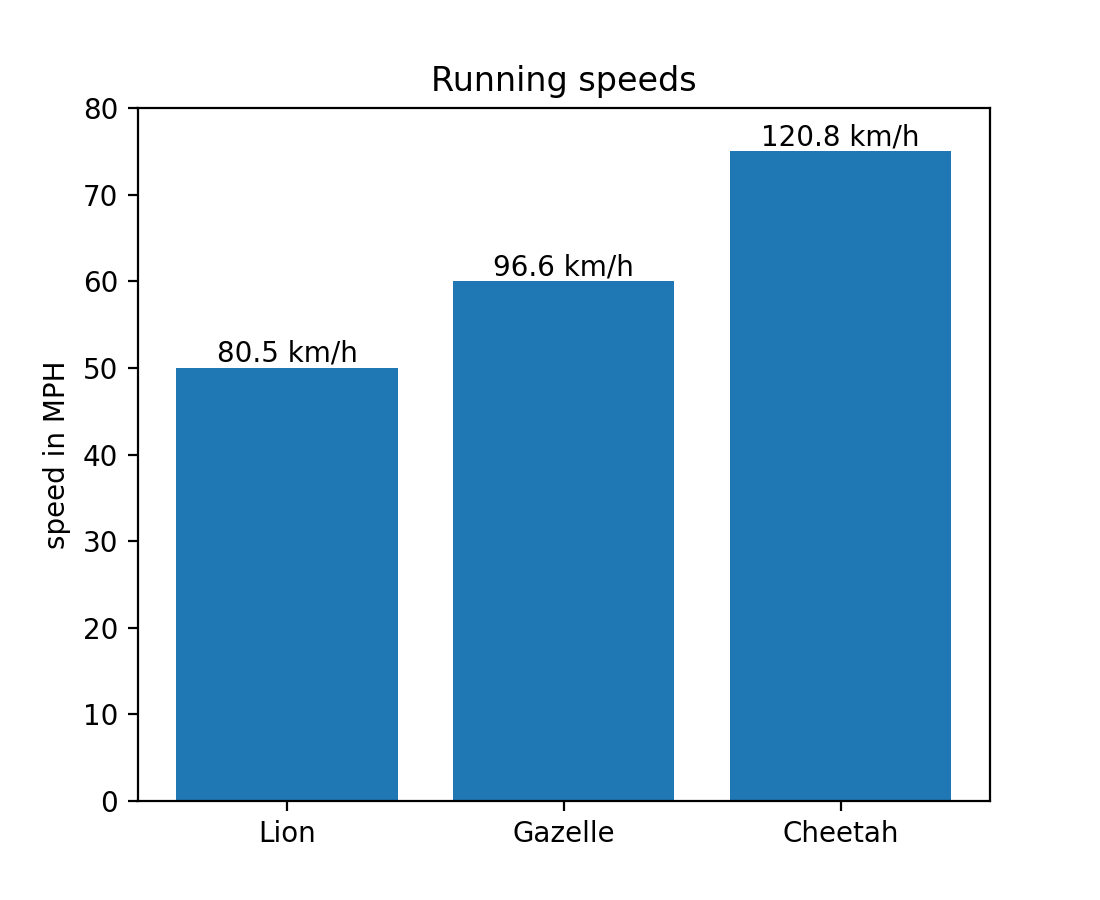
它也接受可呼叫的物件
animal_names = ['Lion', 'Gazelle', 'Cheetah']
mph_speed = [50, 60, 75]

fig, ax = plt.subplots()
bar_container = ax.bar(animal_names, mph_speed)
ax.set(ylabel='speed in MPH', title='Running speeds', ylim=(0, 80))
ax.bar_label(
    bar_container, fmt=lambda x: '{:.1f} km/h'.format(x * 1.61)
)
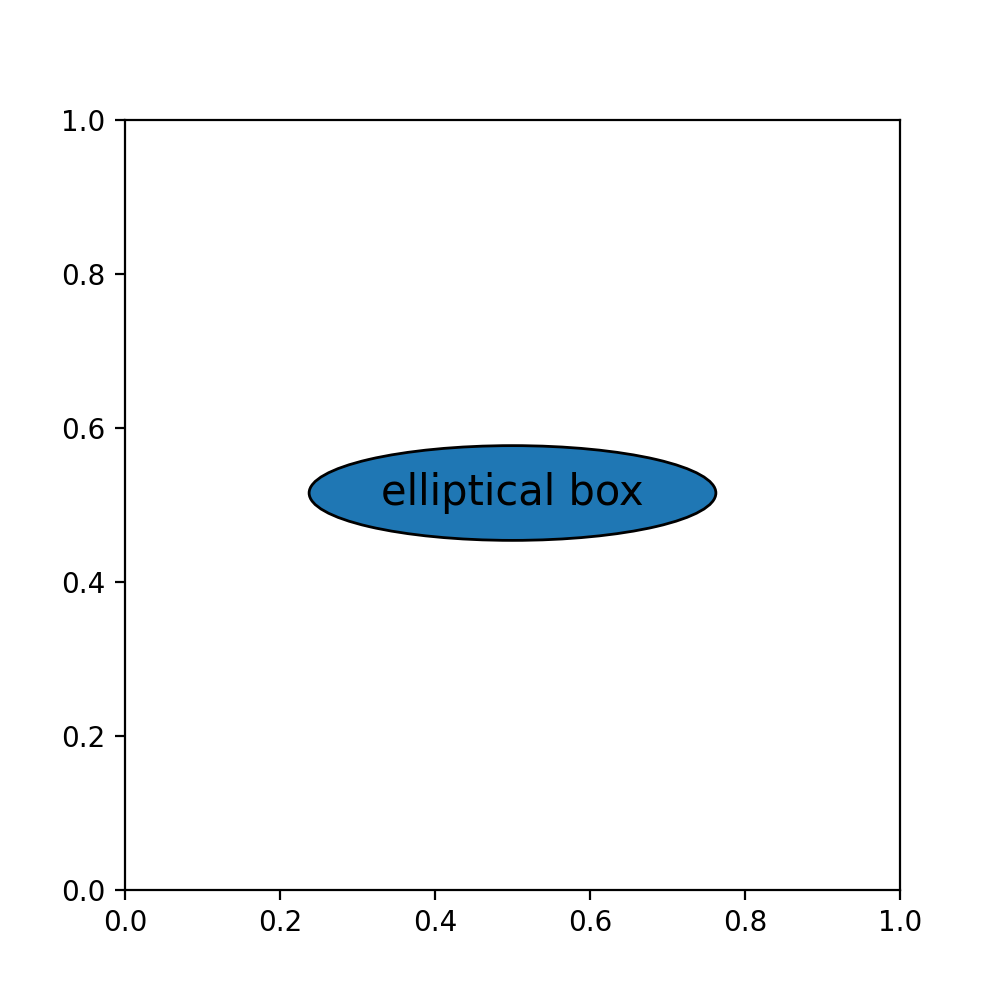
註解的 ellipse boxstyle 選項#
現在,boxstyle 的 'ellipse' 選項可以用於建立具有橢圓形外框的註解。對於較長的文字,它可以作為一個封閉曲線形狀來使用,而不是 'circle' boxstyle,後者可能會變得相當大。
import matplotlib.pyplot as plt
fig, ax = plt.subplots(figsize=(5, 5))
t = ax.text(0.5, 0.5, "elliptical box",
        ha="center", size=15,
        bbox=dict(boxstyle="ellipse,pad=0.3"))
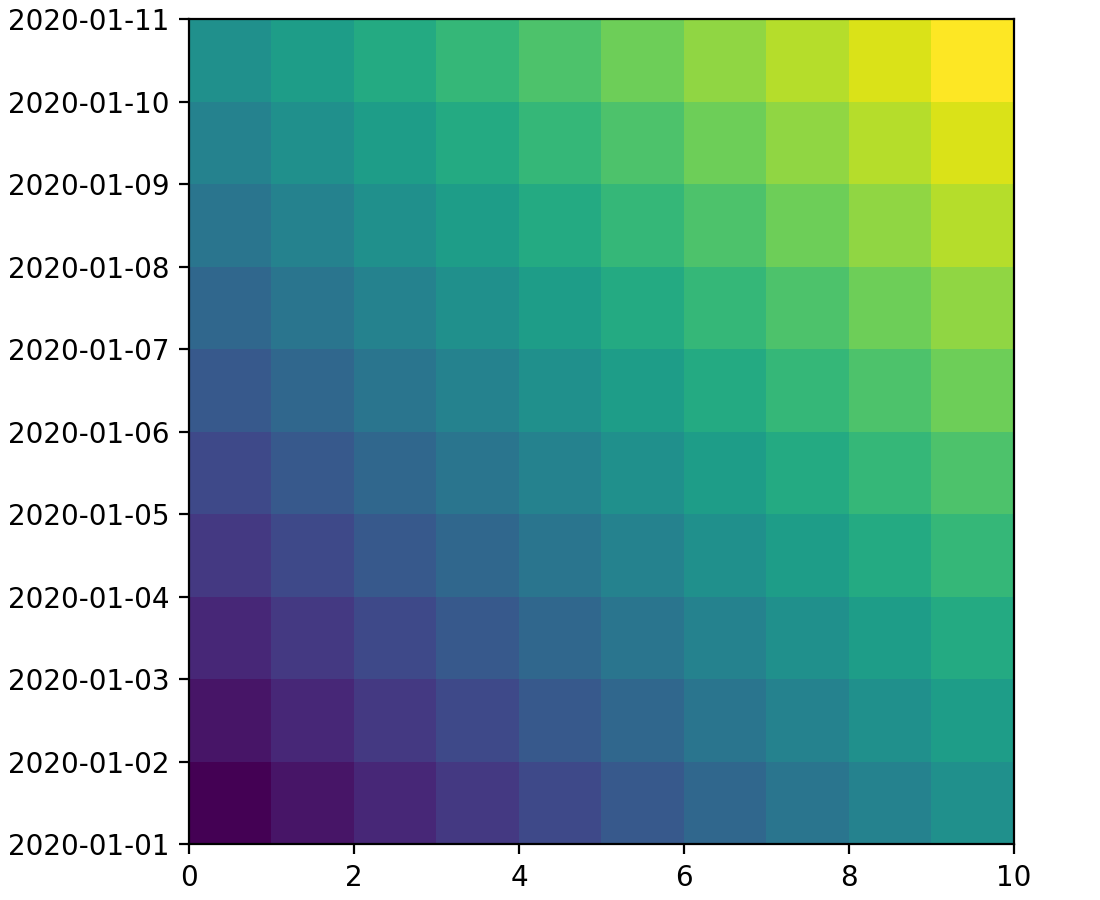
imshow 的範圍現在可以用單位表示#
imshow 和 set_extent 的範圍參數現在可以用單位表示。
import matplotlib.pyplot as plt
import numpy as np

fig, ax = plt.subplots(layout='constrained')
date_first = np.datetime64('2020-01-01', 'D')
date_last = np.datetime64('2020-01-11', 'D')

arr = [[i+j for i in range(10)] for j in range(10)]

ax.imshow(arr, origin='lower', extent=[0, 10, date_first, date_last])

plt.show()
反轉圖例條目的順序#
現在可以通過將 reverse=True 傳遞給 legend 來反轉圖例條目的順序。
pcolormesh 接受 RGB(A) 顏色#
pcolormesh 方法現在可以處理使用 RGB(A) 值指定的明確顏色。要指定顏色,陣列必須是 3D 的,形狀為 (M, N, [3, 4])。
import matplotlib.pyplot as plt
import numpy as np

colors = np.linspace(0, 1, 90).reshape((5, 6, 3))
plt.pcolormesh(colors)
plt.show()

檢視刻度、刻度標籤和格線的目前外觀設定#
新的 get_tick_params 方法可用於檢索將應用於新增到圖表的任何其他刻度、刻度標籤和格線的外觀設定
>>> import matplotlib.pyplot as plt

>>> fig, ax = plt.subplots()
>>> ax.yaxis.set_tick_params(labelsize=30, labelcolor='red',
...                          direction='out', which='major')
>>> ax.yaxis.get_tick_params(which='major')
{'direction': 'out',
'left': True,
'right': False,
'labelleft': True,
'labelright': False,
'gridOn': False,
'labelsize': 30,
'labelcolor': 'red'}
>>> ax.yaxis.get_tick_params(which='minor')
{'left': True,
'right': False,
'labelleft': True,
'labelright': False,
'gridOn': False}
樣式檔案可以從第三方套件匯入#
現在第三方套件可以分發全域可用的樣式檔案,如下所示。假設一個套件可以作為 import mypackage 導入,其中包含 mypackage/__init__.py 模組。然後,mypackage/presentation.mplstyle 樣式表可以作為 plt.style.use("mypackage.presentation") 使用。
該實作實際上不匯入 mypackage,使得這個過程可以安全地避免可能的導入時副作用。子套件(例如,dotted.package.name)也受支援。
3D 繪圖的改進#
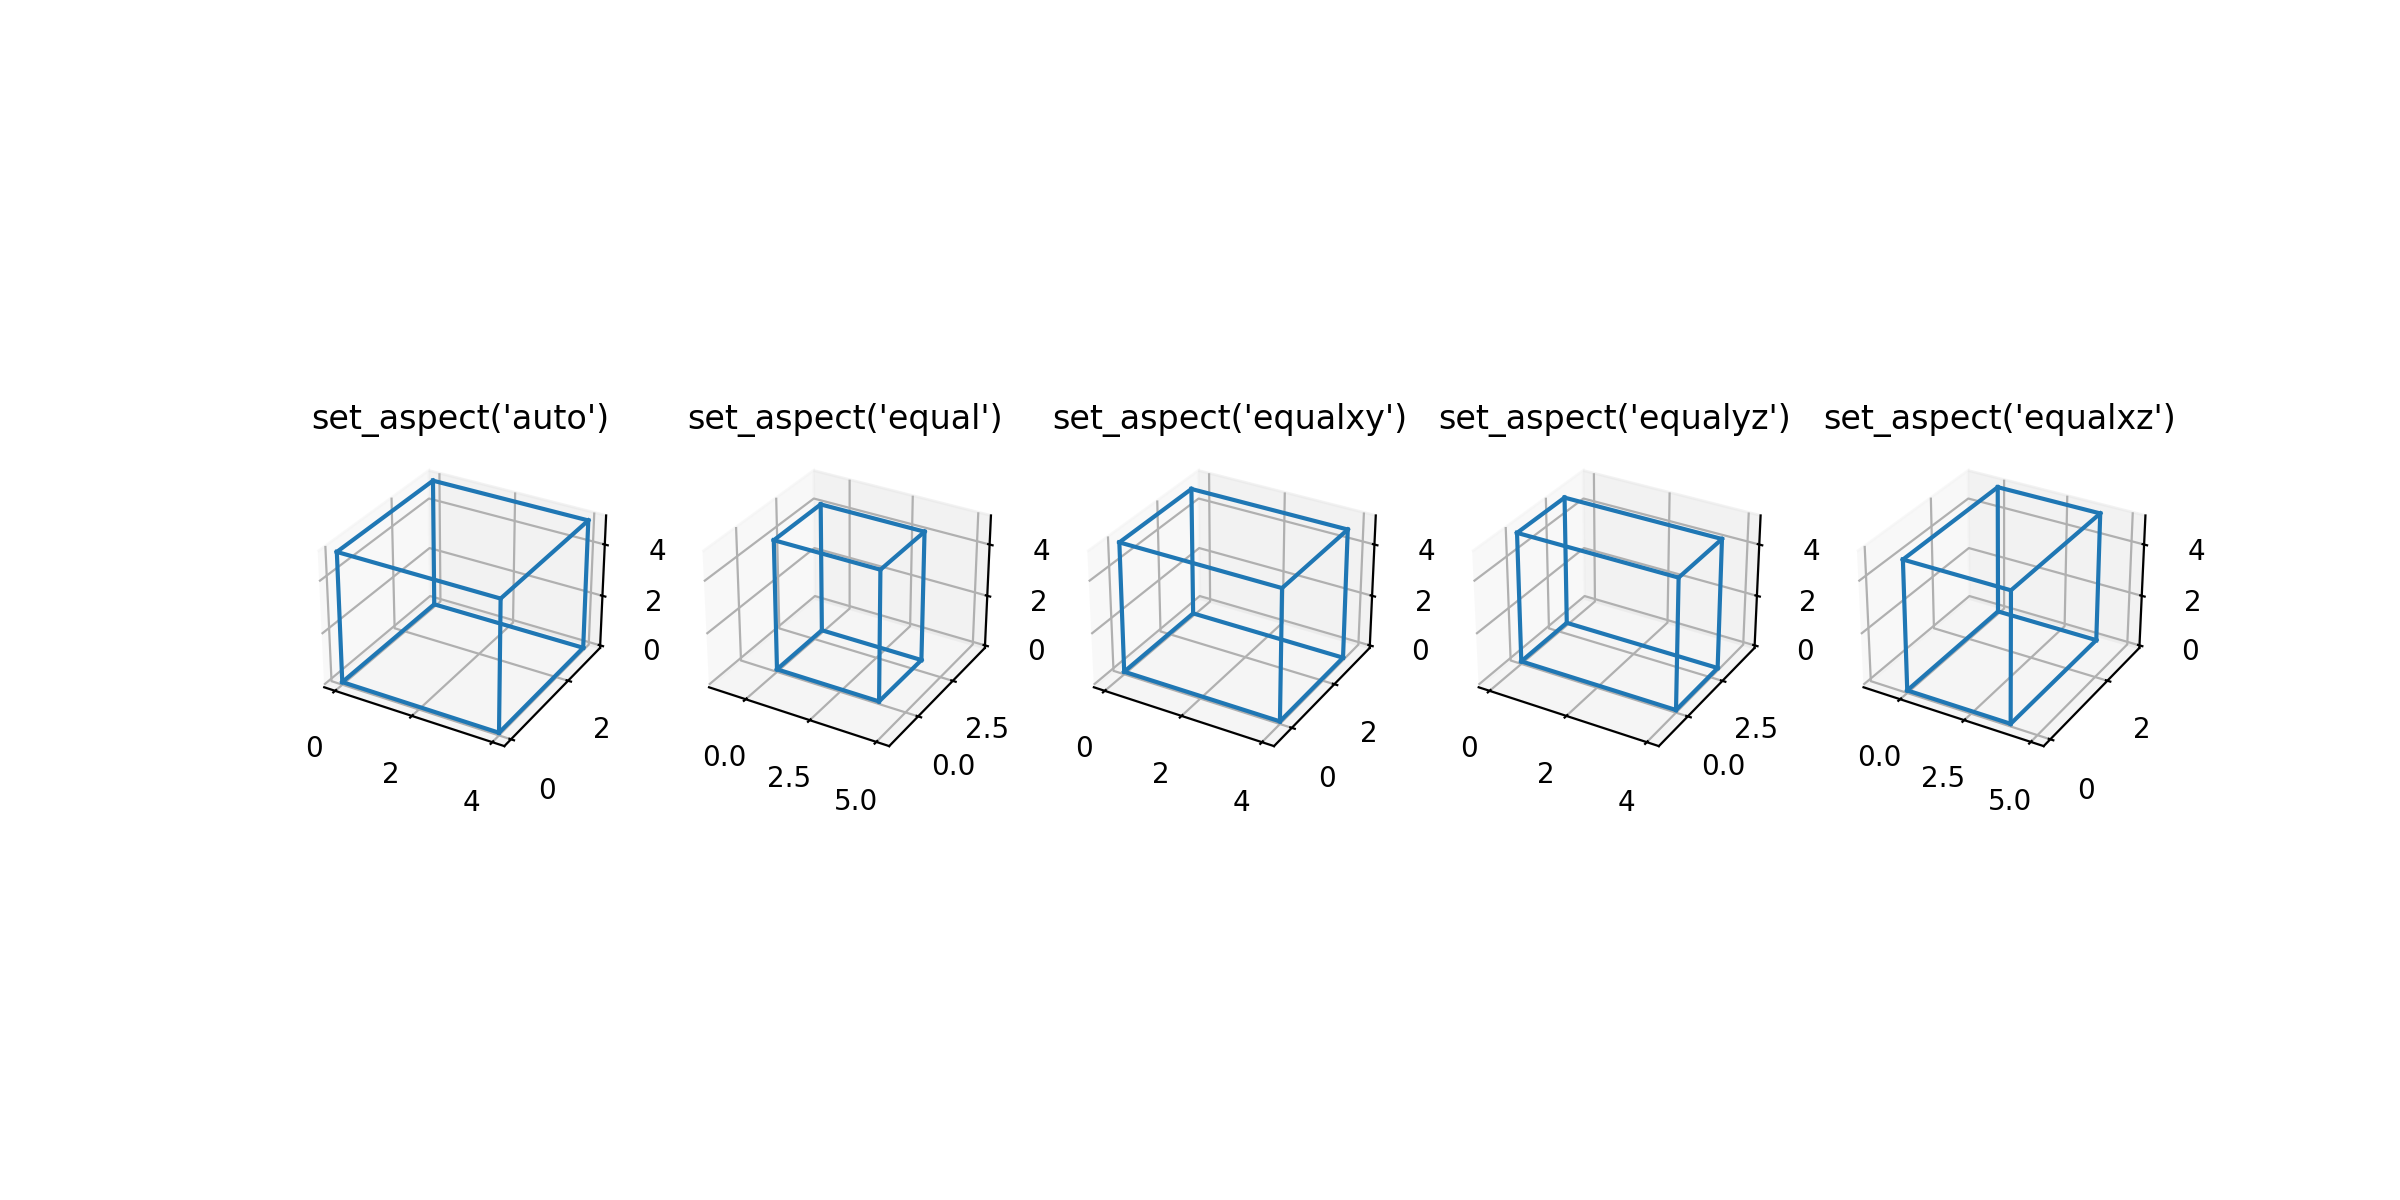
用於在 3D 中設定相等長寬比的 adjustable 關鍵字引數#
在為 3D 圖表設定相等長寬比時,使用者可以選擇修改資料限制或邊界框,使其與 2D 軸一致。
import matplotlib.pyplot as plt
import numpy as np
from itertools import combinations, product

aspects = ('auto', 'equal', 'equalxy', 'equalyz', 'equalxz')
fig, axs = plt.subplots(1, len(aspects), subplot_kw={'projection': '3d'},
                        figsize=(12, 6))

# Draw rectangular cuboid with side lengths [4, 3, 5]
r = [0, 1]
scale = np.array([4, 3, 5])
pts = combinations(np.array(list(product(r, r, r))), 2)
for start, end in pts:
    if np.sum(np.abs(start - end)) == r[1] - r[0]:
        for ax in axs:
            ax.plot3D(*zip(start*scale, end*scale), color='C0')

# Set the aspect ratios
for i, ax in enumerate(axs):
    ax.set_aspect(aspects[i], adjustable='datalim')
    # Alternatively: ax.set_aspect(aspects[i], adjustable='box')
    # which will change the box aspect ratio instead of axis data limits.
    ax.set_title(f"set_aspect('{aspects[i]}')")

plt.show()
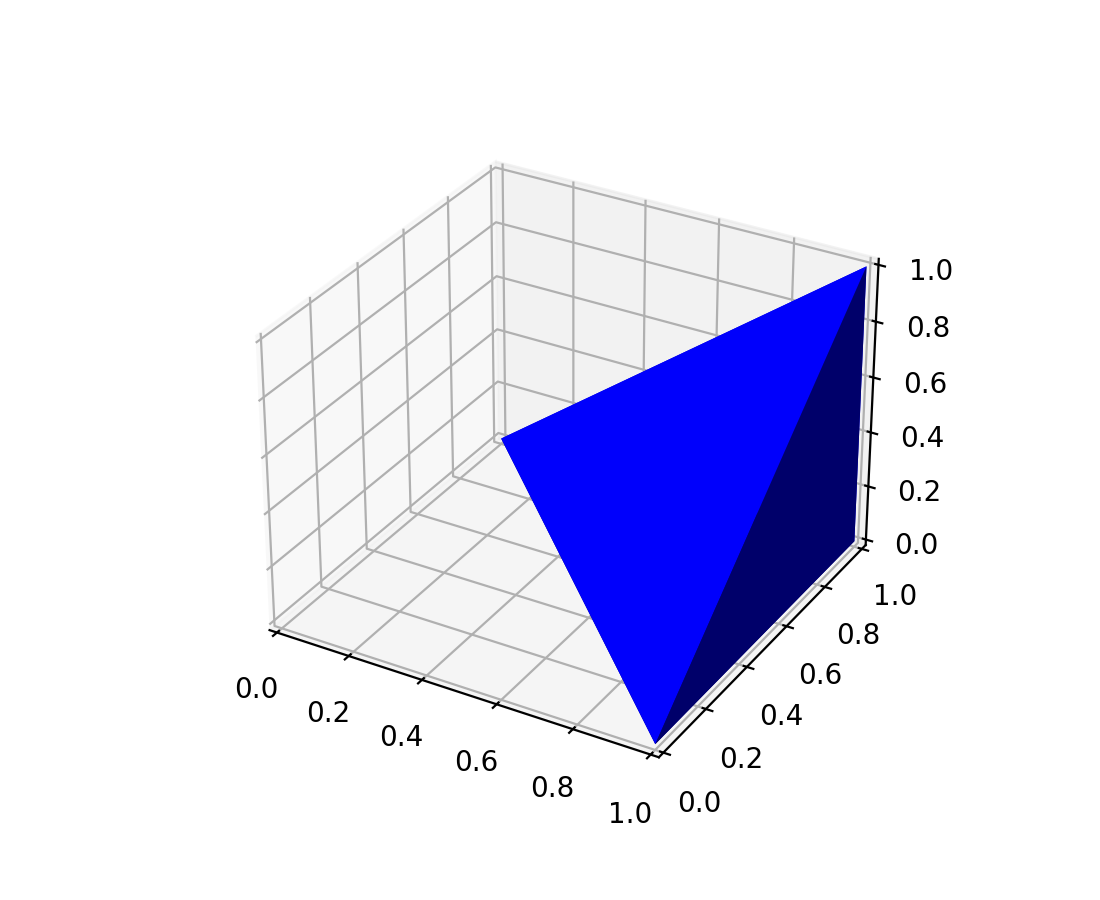
Poly3DCollection 支援陰影#
現在可以對 Poly3DCollection 進行陰影處理。如果多邊形是從例如 3D 模型取得的,這會很有用。
import numpy as np
import matplotlib.pyplot as plt
from mpl_toolkits.mplot3d.art3d import Poly3DCollection

# Define 3D shape
block = np.array([
    [[1, 1, 0],
     [1, 0, 0],
     [0, 1, 0]],
    [[1, 1, 0],
     [1, 1, 1],
     [1, 0, 0]],
    [[1, 1, 0],
     [1, 1, 1],
     [0, 1, 0]],
    [[1, 0, 0],
     [1, 1, 1],
     [0, 1, 0]]
])

ax = plt.subplot(projection='3d')
pc = Poly3DCollection(block, facecolors='b', shade=True)
ax.add_collection(pc)
plt.show()
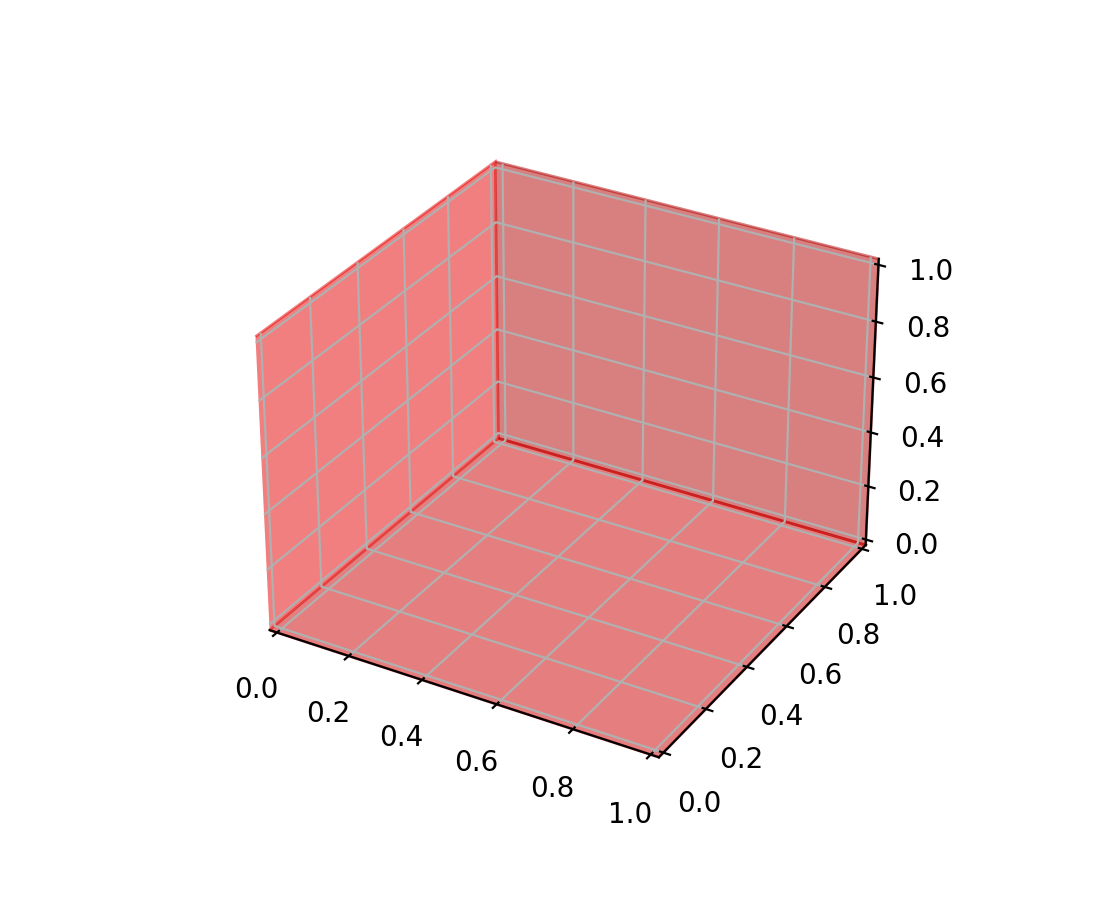
用於 3D 面板顏色的 rcParam#
rcParams rcParams["axes3d.xaxis.panecolor"] (預設值:(0.95, 0.95, 0.95, 0.5))、rcParams["axes3d.yaxis.panecolor"] (預設值:(0.9, 0.9, 0.9, 0.5)) 和 rcParams["axes3d.zaxis.panecolor"] (預設值:(0.925, 0.925, 0.925, 0.5)) 可用於變更 3D 圖表中背景面板的顏色。請注意,通常最好為它們提供稍微不同的陰影,以獲得「3D 效果」,並使它們稍微透明 (alpha < 1)。
import matplotlib.pyplot as plt
with plt.rc_context({'axes3d.xaxis.panecolor': (0.9, 0.0, 0.0, 0.5),
                     'axes3d.yaxis.panecolor': (0.7, 0.0, 0.0, 0.5),
                     'axes3d.zaxis.panecolor': (0.8, 0.0, 0.0, 0.5)}):
    fig = plt.figure()
    fig.add_subplot(projection='3d')
圖表和軸配置#
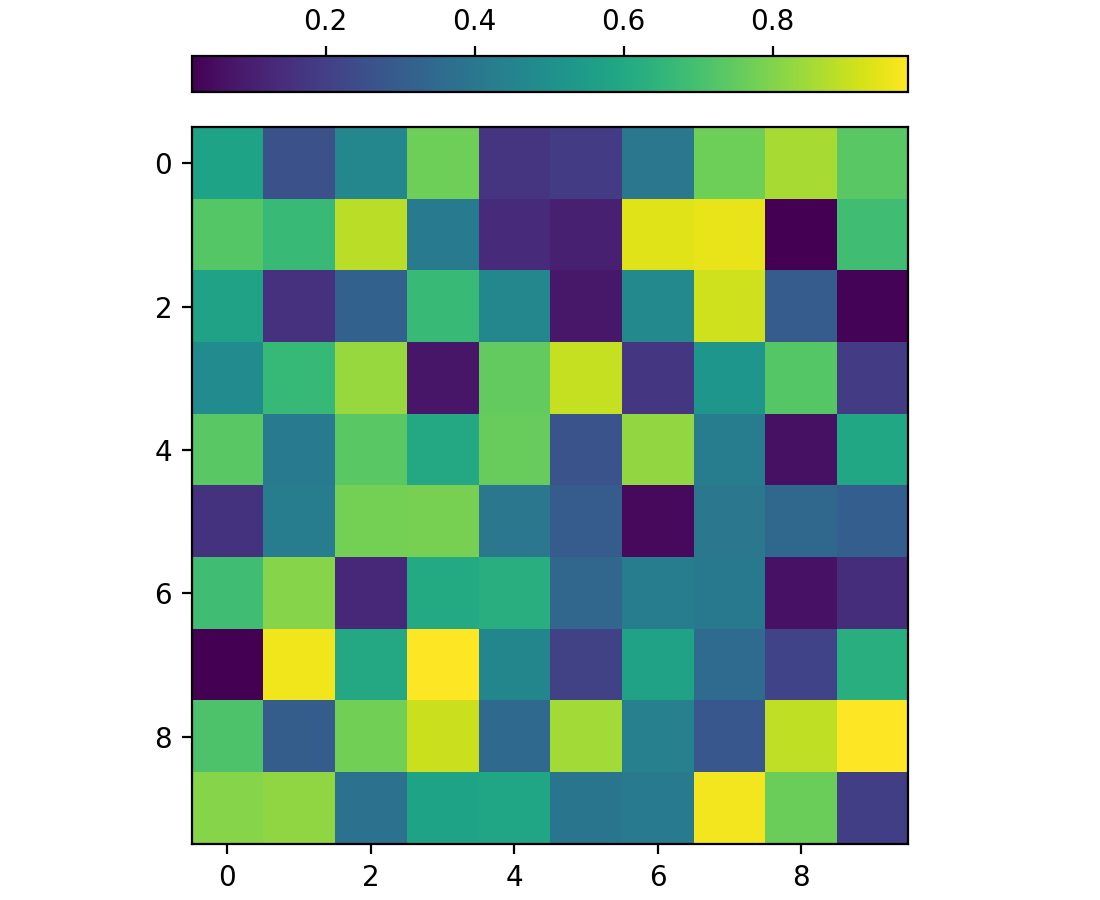
colorbar 現在具有 location 關鍵字引數#
colorbar 方法現在支援 location 關鍵字引數,以便更輕鬆地定位顏色條。當使用 cax 關鍵字引數提供自己的插入軸時,這會很有用,並且行為類似於未提供軸的情況 (其中會傳遞 location 關鍵字)。不再需要 orientation 和 ticklocation,因為它們由 location 決定。如果不需要自動設定,仍然可以提供 ticklocation。(也可以提供 orientation,但必須與 location 相容。)
一個範例如下
import matplotlib.pyplot as plt
import numpy as np
rng = np.random.default_rng(19680801)
imdata = rng.random((10, 10))
fig, ax = plt.subplots(layout='constrained')
im = ax.imshow(imdata)
fig.colorbar(im, cax=ax.inset_axes([0, 1.05, 1, 0.05]),
             location='top')
可以使用 constrained_layout 將圖例放置在圖表之外#
如果圖例由以字串 "outside" 開頭的 loc 關鍵字引數指定,則 constrained layout 會為圖例留出空間。程式碼與軸程式碼不同,其中 "outside upper right" 會在圖表的頂部為圖例留出空間,而 "outside right upper" 會在圖表的右側留出空間。請參閱 圖例指南 以瞭解詳細資訊。
subplot_mosaic 中的每個子圖的關鍵字引數#
現在可以在每次呼叫 add_subplot 時,將關鍵字引數傳遞給 Figure.subplot_mosaic 和 pyplot.subplot_mosaic 的 Axes 建立中。
fig, axd = plt.subplot_mosaic(
    "AB;CD",
    per_subplot_kw={
        "A": {"projection": "polar"},
        ("C", "D"): {"xscale": "log"},
        "B": {"projection": "3d"},
    },
)

這對於建立具有混合投影的馬賽克圖特別有用,但任何關鍵字引數都可以傳遞。
subplot_mosaic 不再是臨時性的#
現在認為 Figure.subplot_mosaic 和 pyplot.subplot_mosaic 的 API 是穩定的,並且會依照 Matplotlib 的正常棄用流程進行變更。
小工具改進#
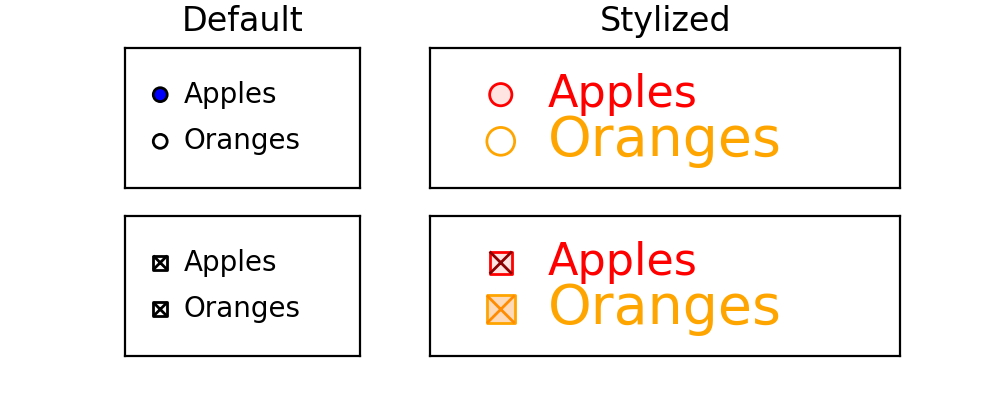
按鈕小工具的自訂樣式#
可以透過 RadioButtons 的 *label_props* 和 *radio_props* 引數;以及 CheckButtons 的 *label_props*、*frame_props* 和 *check_props* 引數來達成按鈕小工具的其他自訂樣式。
from matplotlib.widgets import CheckButtons, RadioButtons

fig, ax = plt.subplots(nrows=2, ncols=2, figsize=(5, 2), width_ratios=[1, 2])
default_rb = RadioButtons(ax[0, 0], ['Apples', 'Oranges'])
styled_rb = RadioButtons(ax[0, 1], ['Apples', 'Oranges'],
                         label_props={'color': ['red', 'orange'],
                                      'fontsize': [16, 20]},
                         radio_props={'edgecolor': ['red', 'orange'],
                                      'facecolor': ['mistyrose', 'peachpuff']})

default_cb = CheckButtons(ax[1, 0], ['Apples', 'Oranges'],
                          actives=[True, True])
styled_cb = CheckButtons(ax[1, 1], ['Apples', 'Oranges'],
                         actives=[True, True],
                         label_props={'color': ['red', 'orange'],
                                      'fontsize': [16, 20]},
                         frame_props={'edgecolor': ['red', 'orange'],
                                      'facecolor': ['mistyrose', 'peachpuff']},
                         check_props={'color': ['darkred', 'darkorange']})

ax[0, 0].set_title('Default')
ax[0, 1].set_title('Stylized')
其他改進#
圖形掛鉤#
新的 rcParams["figure.hooks"] (預設:[])提供了一種機制,可在 pyplot 圖形上註冊任意自訂設定;它是一個「dotted.module.name:dotted.callable.name」字串列表,指定在 pyplot.figure 建立的每個圖形上呼叫的函式;這些函式可以附加回呼或修改工具列。請參閱 mplcvd -- 圖形掛鉤的範例 以取得工具列自訂的範例。