mpl-probscale:用於 matplotlib 的真實機率尺度

https://github.com/matplotlib/mpl-probscale
安裝
正式發布版本
正式發布版本可透過 conda-forge 頻道或 pip 取得
conda install mpl-probscale --channel=conda-forge
或
pip install probscale
開發版本
這是一個純 Python 套件,因此在所有平台上從原始碼建置都很容易
git clone [email protected]:matplotlib/mpl-probscale.git
cd mpl-probscale
pip install -e .
快速入門
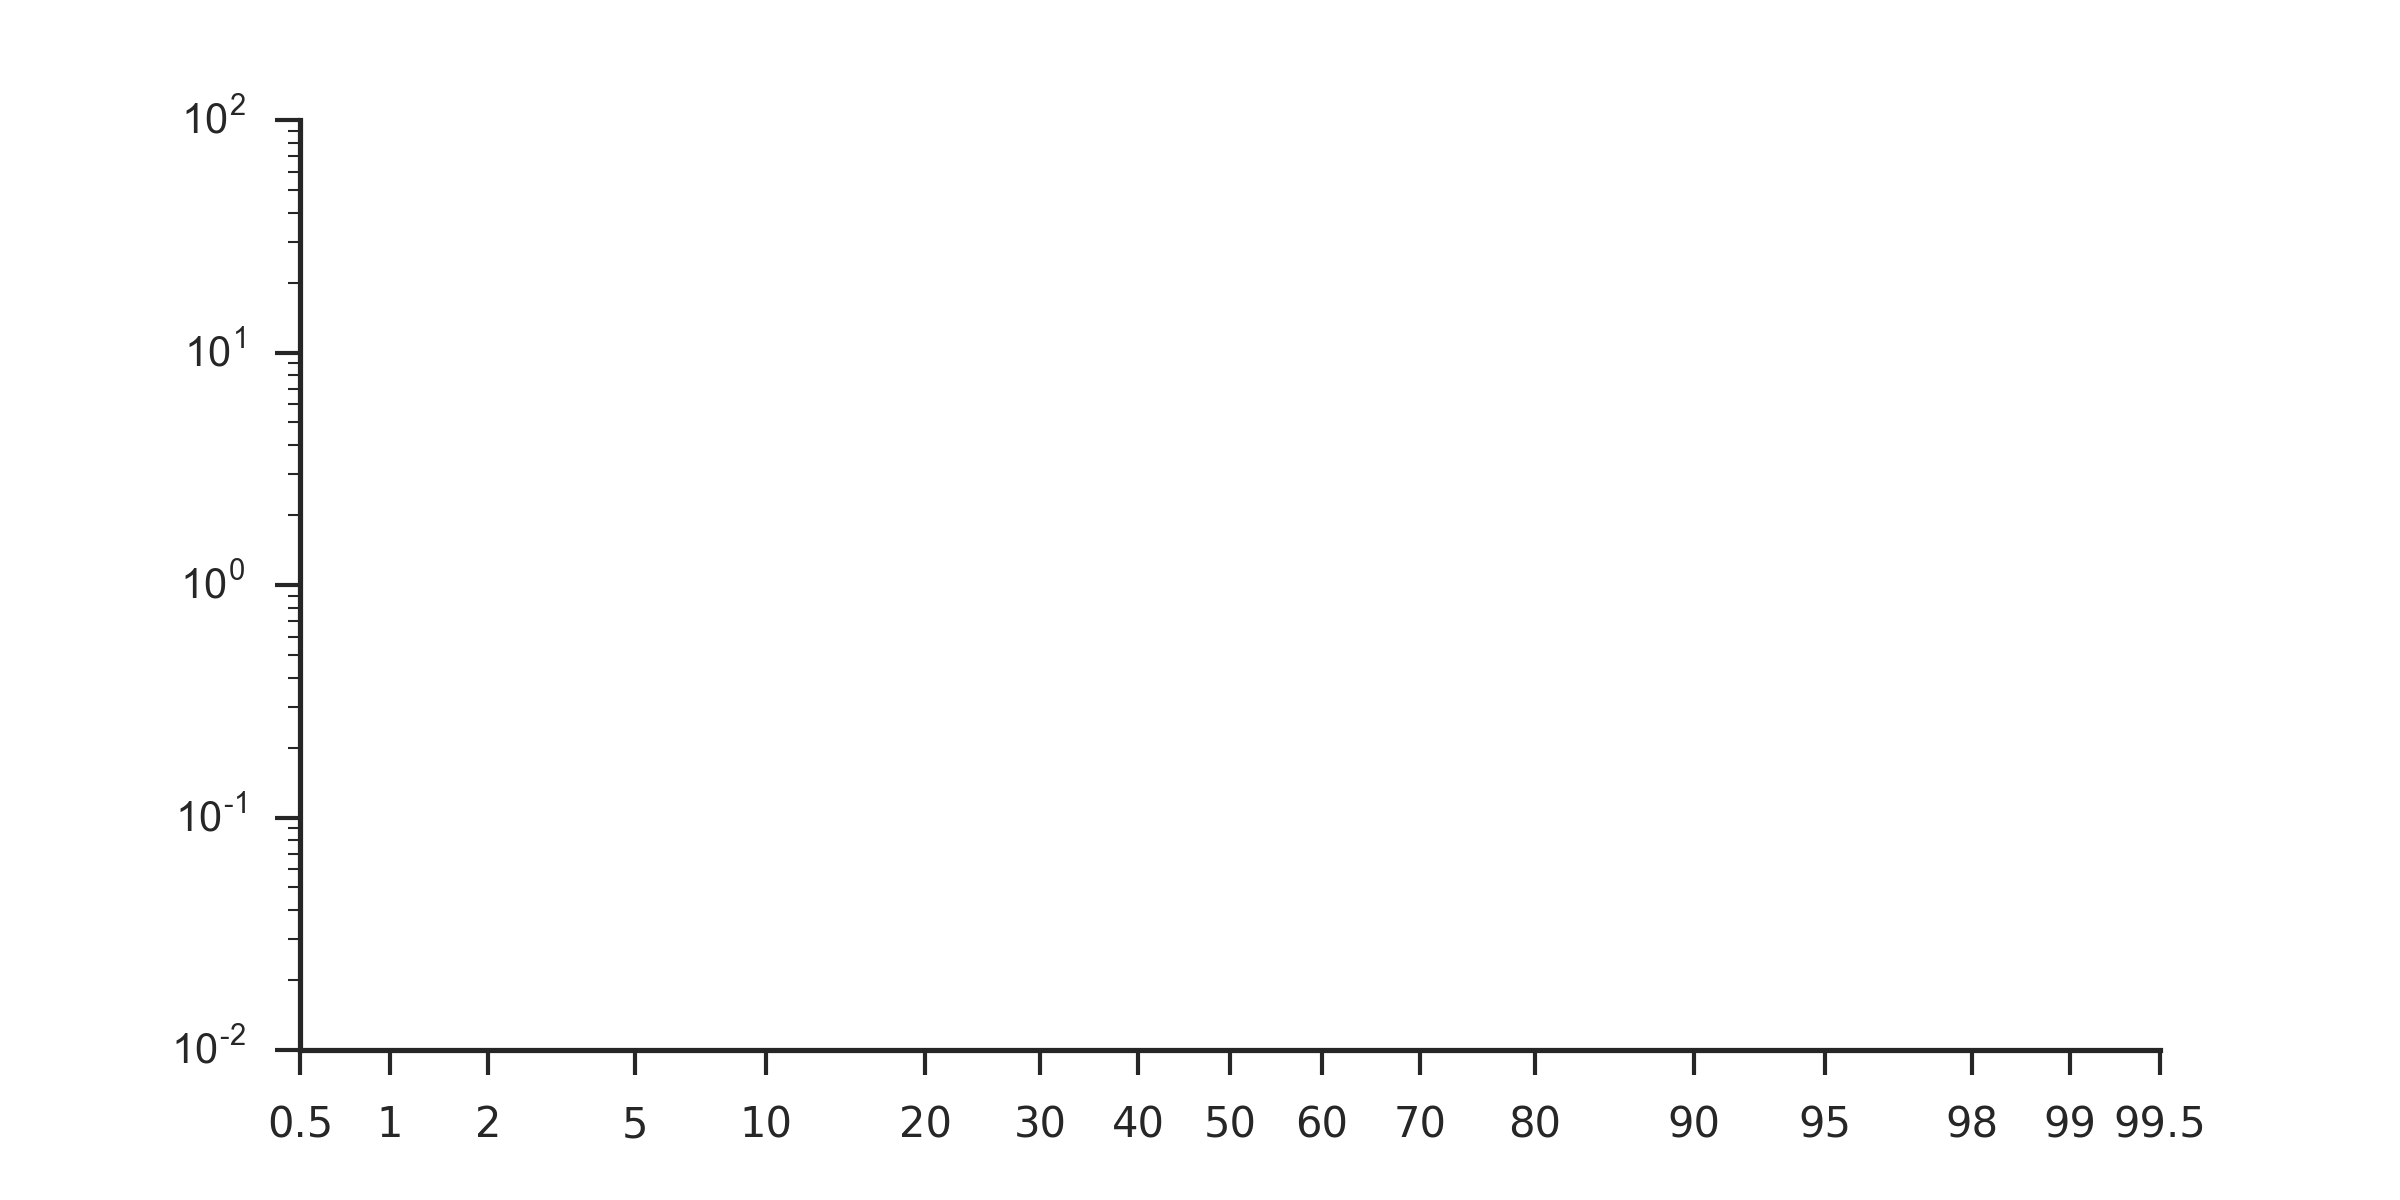
只需匯入 probscale 即可在您的 matplotlib 圖形中使用機率尺度
import matplotlib.pyplot as plt
import probscale
import seaborn
clear_bkgd = {'axes.facecolor':'none', 'figure.facecolor':'none'}
seaborn.set(style='ticks', context='notebook', rc=clear_bkgd)

fig, ax = plt.subplots(figsize=(8, 4))
ax.set_ylim(1e-2, 1e2)
ax.set_yscale('log')

ax.set_xlim(0.5, 99.5)
ax.set_xscale('prob')
seaborn.despine(fig=fig)
教學
測試
從互動式 Python 工作階段執行測試最容易
import matplotlib
matplotlib.use('agg')
import probscale
probscale.test()