注意
前往結尾以下載完整的範例程式碼。
藝術家教學#
使用「藝術家」物件在畫布上渲染。
Matplotlib API 有三個層級。
matplotlib.backend_bases.FigureCanvas是繪製圖形的區域matplotlib.backend_bases.Renderer是一個知道如何在matplotlib.backend_bases.FigureCanvas上繪圖的物件而
matplotlib.artist.Artist是一個知道如何使用渲染器在畫布上繪圖的物件。
matplotlib.backend_bases.FigureCanvas 和 matplotlib.backend_bases.Renderer 處理與使用者介面工具組(如 wxPython)或繪圖語言(如 PostScript®)溝通的所有細節,而 Artist 則處理所有高階的結構,如表示和佈局圖形、文字和線條。一般使用者將花費 95% 的時間與 Artist 互動。
有兩種類型的 Artist:基本圖元和容器。基本圖元表示我們想要繪製在畫布上的標準圖形物件:Line2D、Rectangle、Text、AxesImage 等,而容器則是放置它們的位置(Axis、Axes 和 Figure)。標準用法是建立一個 Figure 實例,使用 Figure 建立一個或多個 Axes 實例,並使用 Axes 實例的輔助方法來建立基本圖元。在下面的範例中,我們使用 matplotlib.pyplot.figure() 建立一個 Figure 實例,這是一個方便的方法,用於實例化 Figure 實例並將它們與您的使用者介面或繪圖工具組 FigureCanvas 連接。正如我們將在下面討論的,這不是必要的 -- 您可以直接使用 PostScript、PDF Gtk+ 或 wxPython FigureCanvas 實例,直接實例化您的 Figure 並自行連接它們 -- 但由於我們在這裡重點關注 Artist API,我們將讓 pyplot 為我們處理其中一些細節
import matplotlib.pyplot as plt
fig = plt.figure()
ax = fig.add_subplot(2, 1, 1) # two rows, one column, first plot
Axes 可能是 Matplotlib API 中最重要的類別,也是您大部分時間會使用的類別。這是因為 Axes 是大多數物件放置的繪圖區域,而且 Axes 有許多特殊的輔助方法(plot()、text()、hist()、imshow())來建立最常用的圖形基本圖元(分別是 Line2D、Text、Rectangle、AxesImage)。這些輔助方法將採用您的資料(例如,numpy 陣列和字串),並根據需要建立基本 Artist 實例(例如,Line2D),將它們新增到相關的容器中,並在要求時繪製它們。如果您想在任意位置建立一個 Axes,只需使用 add_axes() 方法,該方法採用 0-1 相對圖形座標中的 [左, 下, 寬, 高] 值列表
fig2 = plt.figure()
ax2 = fig2.add_axes([0.15, 0.1, 0.7, 0.3])
繼續我們的範例
在這個範例中,ax 是由上述 fig.add_subplot 呼叫建立的 Axes 實例,當您呼叫 ax.plot 時,它會建立一個 Line2D 實例並將其新增到 Axes。在下面的互動式 IPython 工作階段中,您可以看到 Axes.lines 列表的長度為一,並且包含與 line, = ax.plot... 呼叫傳回的相同線條
如果您後續呼叫 ax.plot(且 hold 狀態為「開啟」,這是預設值),則會將其他線條新增到列表中。您可以稍後呼叫其 remove 方法來移除一條線
Axes 也有輔助方法來設定和裝飾 x 軸和 y 軸刻度、刻度標籤和軸標籤
當您呼叫 ax.set_xlabel 時,它會將資訊傳遞到 Text 實例,該實例是 XAxis 的一部分。每個 Axes 實例都包含一個 XAxis 和一個 YAxis 實例,它們處理刻度、刻度標籤和軸標籤的佈局和繪製。
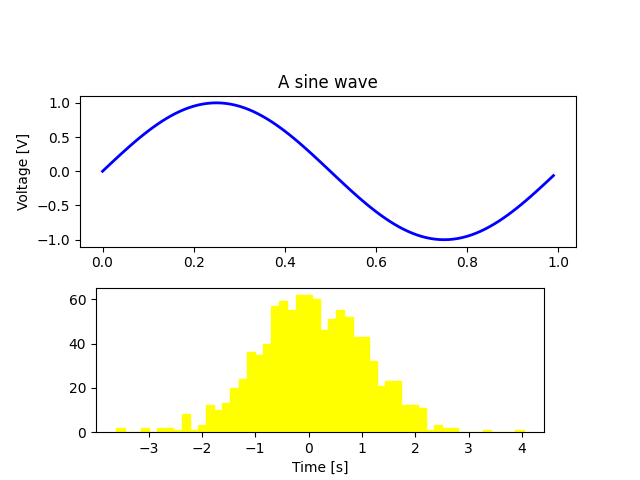
嘗試建立下面的圖形。
import matplotlib.pyplot as plt
import numpy as np

fig = plt.figure()
fig.subplots_adjust(top=0.8)
ax1 = fig.add_subplot(211)
ax1.set_ylabel('Voltage [V]')
ax1.set_title('A sine wave')

t = np.arange(0.0, 1.0, 0.01)
s = np.sin(2*np.pi*t)
line, = ax1.plot(t, s, color='blue', lw=2)

# Fixing random state for reproducibility
np.random.seed(19680801)

ax2 = fig.add_axes([0.15, 0.1, 0.7, 0.3])
n, bins, patches = ax2.hist(np.random.randn(1000), 50,
                            facecolor='yellow', edgecolor='yellow')
ax2.set_xlabel('Time [s]')

plt.show()
自訂您的物件#
圖表中的每個元素都由一個 Matplotlib Artist 表示,並且每個元素都有大量的屬性可以設定其外觀。圖表本身包含一個與圖表大小完全相同的 Rectangle,您可以使用它來設定圖表的背景顏色和透明度。同樣地,每個 Axes 邊界框(典型 Matplotlib 繪圖中帶有黑色邊緣的標準白色框)都有一個 Rectangle 實例,用於確定 Axes 的顏色、透明度和其他屬性。這些實例儲存為成員變數 Figure.patch 和 Axes.patch ("Patch" 是從 MATLAB 繼承的名稱,是指圖表上 2D 的顏色「區塊」,例如矩形、圓形和多邊形)。每個 Matplotlib Artist 都有以下屬性
屬性 |
描述 |
|---|---|
alpha |
透明度 - 介於 0 到 1 之間的純量 |
animated |
一個布林值,用於輔助動畫繪圖 |
axes |
Artist 所在的 Axes,可能為 None |
clip_box |
剪裁 Artist 的邊界框 |
clip_on |
是否啟用剪裁 |
clip_path |
Artist 剪裁的路徑 |
contains |
一個選取函數,用於測試 Artist 是否包含選取點 |
figure |
Artist 所在的圖表實例,可能為 None |
label |
文字標籤(例如,用於自動標籤) |
picker |
一個控制物件選取的 Python 物件 |
transform |
轉換 |
visible |
一個布林值,表示是否應該繪製 Artist |
zorder |
一個數字,決定繪製順序 |
rasterized |
布林值;將向量圖形轉換為點陣圖形(用於壓縮和 EPS 透明度) |
每個屬性都使用傳統的 setter 或 getter 來存取(是的,我們知道這會讓 Python 愛好者感到惱火,我們計劃支援透過屬性或 trait 直接存取,但尚未完成)。例如,要將目前的 alpha 值乘以一半:
a = o.get_alpha()
o.set_alpha(0.5*a)
如果要一次設定多個屬性,也可以使用帶有關鍵字引數的 set 方法。例如:
o.set(alpha=0.5, zorder=2)
如果您在 Python Shell 中進行互動式操作,則檢查 Artist 屬性的一個方便方法是使用 matplotlib.artist.getp() 函式(在 pyplot 中簡稱為 getp()),它會列出屬性和它們的值。這也適用於從 Artist 衍生的類別,例如 Figure 和 Rectangle。以下是上面提到的 Figure 矩形屬性:
In [149]: matplotlib.artist.getp(fig.patch)
  agg_filter = None
  alpha = None
  animated = False
  antialiased or aa = False
  bbox = Bbox(x0=0.0, y0=0.0, x1=1.0, y1=1.0)
  capstyle = butt
  children = []
  clip_box = None
  clip_on = True
  clip_path = None
  contains = None
  data_transform = BboxTransformTo(     TransformedBbox(         Bbox...
  edgecolor or ec = (1.0, 1.0, 1.0, 1.0)
  extents = Bbox(x0=0.0, y0=0.0, x1=640.0, y1=480.0)
  facecolor or fc = (1.0, 1.0, 1.0, 1.0)
  figure = Figure(640x480)
  fill = True
  gid = None
  hatch = None
  height = 1
  in_layout = False
  joinstyle = miter
  label =
  linestyle or ls = solid
  linewidth or lw = 0.0
  patch_transform = CompositeGenericTransform(     BboxTransformTo(   ...
  path = Path(array([[0., 0.],        [1., 0.],        [1.,...
  path_effects = []
  picker = None
  rasterized = None
  sketch_params = None
  snap = None
  transform = CompositeGenericTransform(     CompositeGenericTra...
  transformed_clip_path_and_affine = (None, None)
  url = None
  verts = [[  0.   0.]  [640.   0.]  [640. 480.]  [  0. 480....
  visible = True
  width = 1
  window_extent = Bbox(x0=0.0, y0=0.0, x1=640.0, y1=480.0)
  x = 0
  xy = (0, 0)
  y = 0
  zorder = 1
所有類別的文件字串也包含 Artist 屬性,因此您可以查閱互動式「說明」或 matplotlib.artist 以取得指定物件的屬性清單。
物件容器#
現在我們知道如何檢查和設定要設定的指定物件的屬性,我們需要知道如何存取該物件。正如引言中提到的,有兩種物件:基本物件和容器。基本物件通常是您想要設定的內容(Text 實例的字型,Line2D 的寬度),儘管容器也有一些屬性 - 例如 Axes Artist 是一個容器,包含繪圖中的許多基本物件,但它也具有像 xscale 這樣的屬性,用於控制 xaxis 是「線性」還是「對數」。在本節中,我們將回顧各種容器物件在哪裡儲存您想要存取的 Artist。
圖表容器#
頂層容器 Artist 是 matplotlib.figure.Figure,它包含圖表中的所有內容。圖表的背景是一個 Rectangle,儲存在 Figure.patch 中。當您將子圖 (add_subplot()) 和 Axes (add_axes()) 新增到圖表時,這些子圖和 Axes 將會附加到 Figure.axes。它們也會由建立它們的方法傳回
In [156]: fig = plt.figure()

In [157]: ax1 = fig.add_subplot(211)

In [158]: ax2 = fig.add_axes([0.1, 0.1, 0.7, 0.3])

In [159]: ax1
Out[159]: <Axes:>

In [160]: print(fig.axes)
[<Axes:>, <matplotlib.axes._axes.Axes object at 0x7f0768702be0>]
因為圖表維護了「目前 Axes」的概念(請參閱 Figure.gca 和 Figure.sca)以支援 pylab/pyplot 狀態機,您不應直接從 Axes 清單中插入或移除 Axes,而是應使用 add_subplot() 和 add_axes() 方法插入,並使用 Axes.remove 方法刪除。但是,您可以自由地反覆運算 Axes 清單或索引到其中,以存取您想要自訂的 Axes 實例。以下範例會開啟所有 Axes 的網格:
圖表也有自己的 images、lines、patches 和 text 屬性,您可以使用這些屬性直接新增基本物件。這樣做時,Figure 的預設座標系統將只會以像素為單位(這通常不是您想要的)。如果您改用圖表層級的方法來新增 Artist(例如,使用 Figure.text 來新增文字),則預設座標系統將會是「圖表座標」,其中 (0, 0) 是圖表的左下角,而 (1, 1) 是圖表的右上角。
與所有 Artist 一樣,您可以透過設定 transform 屬性來控制此座標系統。您可以透過將 Artist 轉換設定為 fig.transFigure 來明確使用「圖表座標」
import matplotlib.lines as lines

fig = plt.figure()

l1 = lines.Line2D([0, 1], [0, 1], transform=fig.transFigure, figure=fig)
l2 = lines.Line2D([0, 1], [1, 0], transform=fig.transFigure, figure=fig)
fig.lines.extend([l1, l2])

plt.show()

以下是圖表包含的 Artist 摘要
Axes 容器#
matplotlib.axes.Axes 是 Matplotlib 世界的核心 — 它包含了圖形中絕大多數的 Artist,並提供許多輔助方法來建立和新增這些 Artist 到自身,以及存取和自訂它所包含的 Artist 的輔助方法。如同 Figure,它包含一個 Patch matplotlib.axes.Axes.patch,在笛卡爾坐標系中為一個 Rectangle,而在極坐標系中則為一個 Circle;這個 patch 決定了繪圖區域的形狀、背景和邊框。
ax = fig.add_subplot()
rect = ax.patch  # a Rectangle instance
rect.set_facecolor('green')
當您調用繪圖方法時,例如典型的 plot 並傳入數值陣列或列表時,該方法將建立一個 matplotlib.lines.Line2D 實例,使用作為關鍵字參數傳遞的所有 Line2D 屬性更新該線條,將該線條新增到 Axes,並將其返回給您。
plot 會返回一個線條列表,因為您可以傳入多個 x, y 對來繪製,而我們正在將長度為一的列表的第一個元素解包到 line 變數中。該線條已被新增到 Axes.lines 列表中。
In [229]: print(ax.lines)
[<matplotlib.lines.Line2D at 0xd378b0c>]
類似地,建立 patch 的方法,例如 bar(),會建立一個矩形列表,並將這些 patch 新增到 Axes.patches 列表中。
您不應該直接將物件新增到 Axes.lines 或 Axes.patches 列表中,因為 Axes 在建立和新增物件時需要執行一些操作。
它會設定
Artist的figure和axes屬性;它會設定預設的
Axes轉換 (除非已設定);它會檢查
Artist中包含的數據,以更新控制自動縮放的數據結構,以便可以調整檢視限制以包含繪製的數據。
儘管如此,您仍然可以自行建立物件,並使用諸如 add_line 和 add_patch 等輔助方法將它們直接新增到 Axes。以下是一個帶註解的互動式會話,說明正在發生的事情。
In [262]: fig, ax = plt.subplots()

# create a rectangle instance
In [263]: rect = matplotlib.patches.Rectangle((1, 1), width=5, height=12)

# by default the Axes instance is None
In [264]: print(rect.axes)
None

# and the transformation instance is set to the "identity transform"
In [265]: print(rect.get_data_transform())
IdentityTransform()

# now we add the Rectangle to the Axes
In [266]: ax.add_patch(rect)

# and notice that the ax.add_patch method has set the Axes
# instance
In [267]: print(rect.axes)
Axes(0.125,0.1;0.775x0.8)

# and the transformation has been set too
In [268]: print(rect.get_data_transform())
CompositeGenericTransform(
    TransformWrapper(
        BlendedAffine2D(
            IdentityTransform(),
            IdentityTransform())),
    CompositeGenericTransform(
        BboxTransformFrom(
            TransformedBbox(
                Bbox(x0=0.0, y0=0.0, x1=1.0, y1=1.0),
                TransformWrapper(
                    BlendedAffine2D(
                        IdentityTransform(),
                        IdentityTransform())))),
        BboxTransformTo(
            TransformedBbox(
                Bbox(x0=0.125, y0=0.10999999999999999, x1=0.9, y1=0.88),
                BboxTransformTo(
                    TransformedBbox(
                        Bbox(x0=0.0, y0=0.0, x1=6.4, y1=4.8),
                        Affine2D(
                            [[100.   0.   0.]
                             [  0. 100.   0.]
                             [  0.   0.   1.]])))))))

# the default Axes transformation is ax.transData
In [269]: print(ax.transData)
CompositeGenericTransform(
    TransformWrapper(
        BlendedAffine2D(
            IdentityTransform(),
            IdentityTransform())),
    CompositeGenericTransform(
        BboxTransformFrom(
            TransformedBbox(
                Bbox(x0=0.0, y0=0.0, x1=1.0, y1=1.0),
                TransformWrapper(
                    BlendedAffine2D(
                        IdentityTransform(),
                        IdentityTransform())))),
        BboxTransformTo(
            TransformedBbox(
                Bbox(x0=0.125, y0=0.10999999999999999, x1=0.9, y1=0.88),
                BboxTransformTo(
                    TransformedBbox(
                        Bbox(x0=0.0, y0=0.0, x1=6.4, y1=4.8),
                        Affine2D(
                            [[100.   0.   0.]
                             [  0. 100.   0.]
                             [  0.   0.   1.]])))))))

# notice that the xlimits of the Axes have not been changed
In [270]: print(ax.get_xlim())
(0.0, 1.0)

# but the data limits have been updated to encompass the rectangle
In [271]: print(ax.dataLim.bounds)
(1.0, 1.0, 5.0, 12.0)

# we can manually invoke the auto-scaling machinery
In [272]: ax.autoscale_view()

# and now the xlim are updated to encompass the rectangle, plus margins
In [273]: print(ax.get_xlim())
(0.75, 6.25)

# we have to manually force a figure draw
In [274]: fig.canvas.draw()
有許多 Axes 輔助方法可以建立基本 Artist 並將它們新增到各自的容器中。下表總結了其中的一小部分、它們建立的 Artist 類型,以及它們儲存的位置。
Axes 輔助方法 |
Artist |
容器 |
|---|---|---|
|
ax.texts |
|
|
ax.patches |
|
|
ax.lines 和 ax.patches |
|
|
ax.patches |
|
|
ax.patches |
|
|
ax.images |
|
|
ax.get_legend() |
|
|
ax.lines |
|
|
ax.collections |
|
|
ax.texts |
除了所有這些 Artist 之外,Axes 還包含兩個重要的 Artist 容器:XAxis 和 YAxis,它們負責處理刻度和標籤的繪製。這些會被儲存為實例變數 matplotlib.axes.Axes.xaxis 和 matplotlib.axes.Axes.yaxis。XAxis 和 YAxis 容器將在下面詳細說明,但請注意,Axes 包含許多輔助方法,這些方法會將調用轉發到 Axis 實例,因此除非您想直接使用它們,否則通常不需要直接處理它們。例如,您可以使用 Axes 輔助方法設定 XAxis 刻度標籤的字體顏色。
以下是 Axes 所包含的 Artists 的摘要。
Axes 屬性 |
描述 |
|---|---|
artists |
|
patch |
|
collections |
|
images |
|
lines |
一個 |
patches |
一個 |
texts |
一個 |
xaxis |
一個 |
yaxis |
一個 |
可以使用 get_legend 存取圖例。
軸容器#
matplotlib.axis.Axis 實例處理刻度線、網格線、刻度標籤和軸標籤的繪製。您可以分別設定 y 軸的左右刻度,以及 x 軸的上下刻度。Axis 也會儲存自動縮放、平移和縮放中使用的数据和视图区间,以及控制刻度放置位置和如何以字符串表示刻度的 Locator 和 Formatter 實例。
每個 Axis 物件都包含一個 label 屬性(這是 pyplot 在呼叫 xlabel 和 ylabel 時修改的內容),以及主要和次要刻度的列表。刻度是 axis.XTick 和 axis.YTick 實例,其中包含渲染刻度和刻度標籤的實際線條和文字圖元。由於刻度是根據需要動態建立的(例如,在平移和縮放時),您應該透過它們的存取器方法 axis.Axis.get_major_ticks 和 axis.Axis.get_minor_ticks 來存取主要和次要刻度的列表。儘管刻度包含所有圖元,並將在下面介紹,但 Axis 實例具有返回刻度線、刻度標籤、刻度位置等的存取器方法。
fig, ax = plt.subplots()
axis = ax.xaxis
axis.get_ticklocs()
array([0. , 0.2, 0.4, 0.6, 0.8, 1. ])
[Text(0.0, 0, '0.0'), Text(0.2, 0, '0.2'), Text(0.4, 0, '0.4'), Text(0.6000000000000001, 0, '0.6'), Text(0.8, 0, '0.8'), Text(1.0, 0, '1.0')]
注意,刻度線的數量是標籤的兩倍,因為預設情況下,頂部和底部都有刻度線,但只有 xaxis 下方有刻度標籤;但是,這可以自訂。
<a list of 12 Line2D ticklines objects>
使用上述方法,預設情況下您只會獲得主要刻度的列表,但您也可以要求提供次要刻度
axis.get_ticklabels(minor=True)
axis.get_ticklines(minor=True)
<a list of 0 Line2D ticklines objects>
以下是 Axis 的一些有用存取器方法的摘要(這些方法在有用的情況下具有相應的設定器,例如 set_major_formatter())。
軸存取器方法 |
描述 |
|---|---|
軸的比例,例如「log」或「linear」 |
|
軸視圖限制的區間實例 |
|
軸資料限制的區間實例 |
|
軸的網格線列表 |
|
軸標籤 - 一個 |
|
軸偏移文字 - 一個 |
|
一個 |
|
一個 |
|
刻度位置的列表 - 關鍵字 minor=True|False |
|
主要刻度的 |
|
主要刻度的 |
|
次要刻度的 |
|
次要刻度的 |
|
主要刻度的 |
|
次要刻度的 |
|
開啟或關閉主要或次要刻度的網格 |
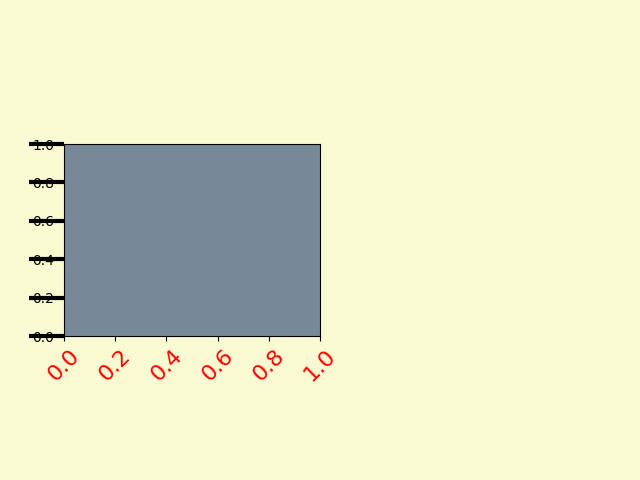
以下是一個範例,不推薦其美觀性,它自訂了軸和刻度屬性。
# plt.figure creates a matplotlib.figure.Figure instance
fig = plt.figure()
rect = fig.patch  # a rectangle instance
rect.set_facecolor('lightgoldenrodyellow')

ax1 = fig.add_axes([0.1, 0.3, 0.4, 0.4])
rect = ax1.patch
rect.set_facecolor('lightslategray')


for label in ax1.xaxis.get_ticklabels():
    # label is a Text instance
    label.set_color('red')
    label.set_rotation(45)
    label.set_fontsize(16)

for line in ax1.yaxis.get_ticklines():
    # line is a Line2D instance
    line.set_color('green')
    line.set_markersize(25)
    line.set_markeredgewidth(3)

plt.show()
刻度容器#
matplotlib.axis.Tick 是我們從 Figure 到 Axes 到 Axis 到 Tick 的下降過程中最終的容器物件。Tick 包含刻度和網格線實例,以及上下刻度的標籤實例。這些都可以直接作為 Tick 的屬性存取。
刻度屬性 |
描述 |
|---|---|
tick1line |
一個 |
tick2line |
一個 |
gridline |
一個 |
label1 |
一個 |
label2 |
一個 |
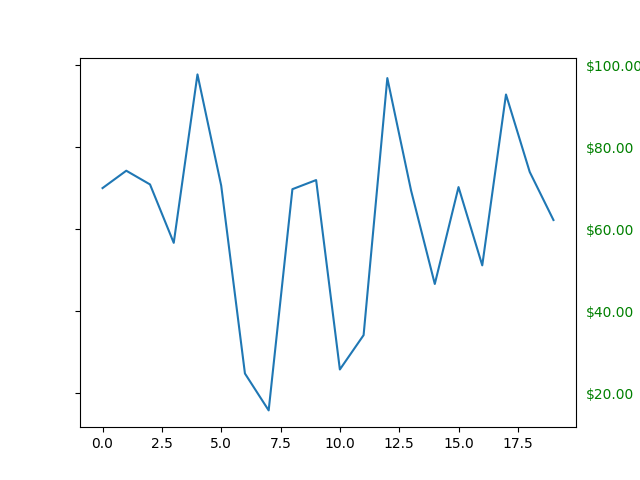
以下是一個範例,它使用美元符號設定右側刻度的格式器,並將它們在 y 軸的右側塗成綠色。
import matplotlib.pyplot as plt
import numpy as np

# Fixing random state for reproducibility
np.random.seed(19680801)

fig, ax = plt.subplots()
ax.plot(100*np.random.rand(20))

# Use automatic StrMethodFormatter
ax.yaxis.set_major_formatter('${x:1.2f}')

ax.yaxis.set_tick_params(which='major', labelcolor='green',
                         labelleft=False, labelright=True)

plt.show()
腳本的總執行時間: (0 分鐘 1.178 秒)